

You want faster inserts right? You only see PAGELATCH_EX waitstats and have some cpu power?
Can inserting data into a table using OPTIMIZE_FOR_SEQUENTIAL_KEY go faster?
Why not find things out in this post — it has what most posts about this flag lack: real numbers at several concurrency levels, including the case where it hurts.
We test it on 2 machines a) win10 -AMD Threadripper 1950 (16/32) and b) win11 AMD Threadripper 5995WX (64)
Recommendation: turn it on for tables with a sequential key (IDENTITY, SEQUENCE, datetime) that can get bursts of concurrent inserts. There’s no downside at low concurrency, and it protects you when a burst hits. For more throughput than about 25,000 rows/sec, the key design itself has to change. But test it, the script is on Github ( https://github.com/ronaldgithub/tsql-mysteries/blob/main/Test-SequentialKey.ps1 )
First win10, let’s settle three things:
- Confirm the 8-session result. “The flag made 8 sessions 11% slower” is your most interesting finding, but it rests on 2 rounds, and my own 8-session run showed no difference. Run -ThreadCounts 8 -Rounds 5 first. If it holds, it’s your headline. If it doesn’t, you’ve avoided publishing noise.
- Say plainly that this is a lab test. Everything ran on one 32-core Developer Edition box, with the sqlcmd clients on the same machine as SQL Server. Also, 100 inserts per transaction was chosen deliberately so log writes (WRITELOG) wouldn’t hide the latch contention. Readers running one autocommit insert per transaction will mostly see log-write waits instead, and they should know that before they try to reproduce it.
- Check the script before sharing it. It defaults to -ServerInstance ‘win10’ and -Database ‘StackOverflow2013′. That’s harmless, but readers will need to change those, so worth pointing out. It contains no credentials (Windows auth only) and nothing else specific to your environment.
A possible outline:
- The claim: “OPTIMIZE_FOR_SEQUENTIAL_KEY makes inserts faster.”
- What it actually targets: last-page latch contention, and why a latch isn’t a lock
- Check first: your real workload probably doesn’t have this problem (the StackOverflow2013 baseline)
- The test setup and the script
- Results at 1, 8 and 64 sessions, plus the wait-statistics chart from Erik Darling’s dashboard
- Reading the chart without being fooled by the sampling interval
- Conclusion: measure PAGELATCH_EX first, then decide
Partly — it’s narrower than that. OPTIMIZE_FOR_SEQUENTIAL_KEY (SQL Server 2019+) does nothing for insert speed in general. It only targets last-page insert contention: many concurrent sessions inserting into a B-tree whose leading key is ever-increasing (IDENTITY, SEQUENCE, GETDATE()), all fighting for the PAGELATCH_EX on the same trailing page.
What it actually does:
- Applies flow control to threads entering the index insert path, so a limited number queue up for the hot page instead of all of them spinning and retrying.
- Reduces the “convoy” effect — a thread getting descheduled while holding the page latch, stalling everyone behind it.
- Introduces the wait type BTREE_INSERT_FLOW_CONTROL. Seeing that wait is expected, not a problem in itself — you’re trading PAGELATCH_EX for it.
When it helps vs. doesn’t:
| Scenario | Effect |
| Dozens+ concurrent singleton inserts, ascending key, narrow rows | Real throughput gain, and more stable latency |
| Single-threaded insert / bulk load / INSERT…SELECT | No gain, tiny overhead |
| Random key (GUID, hash), or contention elsewhere | No gain — wrong problem |
| Contention from wide rows / few rows per page | Marginal — fix the row size instead |
So measure before you set it. Confirm the hot page is real:
-- Are we actually waiting on page latches in that index?

SELECT OBJECT_NAME(ios.object_id) AS table_name,
       i.name AS index_name,
       ios.page_latch_wait_count,
       ios.page_latch_wait_in_ms,
       ios.leaf_insert_count
FROM   sys.dm_db_index_operational_stats(DB_ID(), NULL, NULL, NULL) ios
JOIN   sys.indexes i
       ON i.object_id = ios.object_id AND i.index_id = ios.index_id
WHERE  ios.page_latch_wait_count > 0
ORDER BY ios.page_latch_wait_in_ms DESC;And check live sessions are stacking on one page — wait_type = ‘PAGELATCH_EX’ with the same wait_resource value (db:file:page) across many rows in sys.dm_exec_requests.
Turning it on or off:
ALTER INDEX PK_MyTable ON dbo.MyTable SET (OPTIMIZE_FOR_SEQUENTIAL_KEY = ON);It’s a metadata-only change on SET, so it’s cheap to try and cheap to revert.
If the diagnostics show heavy last-page contention and the flag only partly helps, the bigger levers are changing the key so inserts scatter (hash-partitioned computed column in the clustering key), In-Memory OLTP for the hot table, or batching so each session takes the latch fewer times.
Baseline first: StackOverflow2013 has no last-page contention
Before I loaded anything, the instance-wide waits were:
| Wait | Time (ms) | Tasks |
| WRITELOG | 142,490 | 543,747 |
| PAGELATCH_EX | 1,434 | 50,528 |
| BTREE_INSERT_FLOW_CONTROL | 0 | 0 |
PAGELATCH_EX averaged 0.03 ms per wait — noise. WRITELOG is 100× larger. On your actual workload the flag would do nothing; log flush is the limit.
The synthetic test
Two identical tables, BIGINT IDENTITY clustered PK, ~20-byte rows (so hundreds per page = maximally hot last page). Only difference is the flag. 100 inserts per explicit transaction, so WRITELOG doesn’t mask the latch. Each config run twice in reversed order.
| Sessions | Flag | Elapsed (avg) | Rows/sec | Index latch wait ms | PAGELATCH_EX ms | BTREE_INSERT_FLOW_CONTROL ms |
| 1 | OFF | 2,550 | 58,835 | 0 | 0 | 0 |
| 1 | ON | 2,631 | 57,017 | 0 | 0 | 0 |
| 8 | OFF | 6,502 | 36,913 | 34,620 | 33,566 | 0 |
| 8 | ON | 6,485 | 37,016 | 35,233 | 34,170 | 0 |
| 64 | OFF | 76,777 | 20,840 | 4,466,230 | 3,994,383 | 0 |
| 64 | ON | 65,432 | 24,472 | 1,669,970 | 1,486,841 | 1,938,231 |
Per-run numbers were tight — OFF came in at 76,620 and 76,933 ms; ON at 63,615 and 67,249 ms. Not noise.
What this shows
At 64 sessions: 15% less elapsed time, +17% throughput. Index page-latch wait dropped 63%. Crucially, the flag doesn’t just rename the wait — ON’s combined PAGELATCH_EX + BTREE_INSERT_FLOW_CONTROL is 3.43M ms vs OFF’s 3.99M ms, a 14% real reduction that matches the elapsed-time gain.
At 8 sessions: no difference at all, and BTREE_INSERT_FLOW_CONTROL stayed at exactly 0 — the flow-control mechanism never engaged, even though page latch waits existed. It only activates once contention is severe.
At 1 session: ON was 3% slower (2,631 vs 2,550 ms). Small, but it’s the overhead showing up with nothing to gain.
So your original statement holds only in the top row of that table. The threshold on this box was somewhere between 8 and 64 concurrent inserters — and note that 64 > 32 schedulers, which is exactly the oversubscribed condition the feature was built for.
One caveat on the absolute numbers: I ran 64 sqlcmd processes on the same machine as SQL Server, so client CPU competed with the engine. That inflates elapsed times across the board, but it’s identical for both sides of the A/B.
This is from Erik Darling.
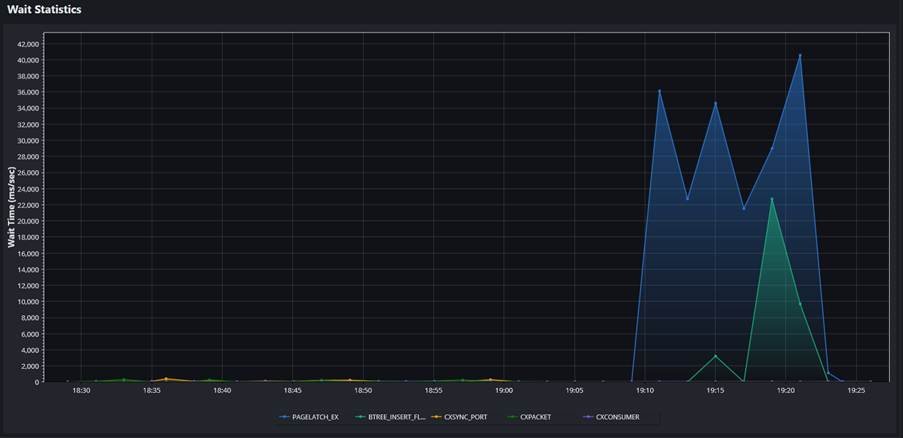
The flat line from 18:30 to ~19:09 is your baseline. Essentially zero PAGELATCH_EX, zero flow control — just small CXPACKET/CXSYNC_PORT blips. That’s the “StackOverflow2013 has no last-page contention” finding, drawn.
Then the load test: PAGELATCH_EX goes from nothing to 20,000–40,000 ms/sec. Worth pausing on those units — 40,000 ms/sec means 40 seconds of accumulated wait per second of wall clock. With 64 sessions running, roughly 40 of them are parked on that one page at any instant. On 32 schedulers, that’s the convoy.
The alternating peaks and troughs are the A/B runs. The troughs (~21,400–22,700) line up with the ON runs and the peaks (~34,700–40,600) with OFF. My per-run deltas normalize to the same place: OFF ≈ 51,900 ms/sec of PAGELATCH_EX, ON ≈ 22,700 ms/sec.
And BTREE_INSERT_FLOW_CONTROL — flat zero for most of the window, appearing only in the segments where the ON table was being loaded. That’s the clearest visual proof that the feature engaged only where it was enabled. Measured, it ran ≈30,000 ms/sec during ON runs.
One caveat on reading it too precisely: the points are ~2 minutes apart, but each individual run lasted only 65–77 seconds. So every bucket blends parts of two runs, which flattens the peaks and shifts the flow-control curve relative to where you’d expect it. That’s why the chart’s OFF peaks top out at 40,600 rather than the ~51,900 the DMV deltas imply. The shape is right; don’t attribute any single point to a single run.
The net is still the point worth keeping: PAGELATCH_EX drops by roughly half, but a large flow-control wait appears in its place. The flag converts a chaotic latch scrum into an orderly queue. The win is the ~15% elapsed time, not the disappearance of the blue line.
One practical note if you do clear wait stats — DBA Dash derives these from deltas of the cumulative DMV, so a DBCC SQLPERF(…CLEAR) will make the next collection interval read as a reset rather than a real drop. Harmless, but it’ll put a notch in this graph
The per-row latch cost at 64 sessions matches to within 1.5% across runs that differ 2× in size. The harness is measuring the same thing both times.
Where your run agrees with mine:
- 1 session: ON 2.8% slower (I got 3.2%). Zero latch waits, zero flow control. The small consistent overhead of a feature with nothing to do.
- 64 sessions: ON clearly faster, latch wait down 66% (2,263,575 → 767,490 ms) with 864,434 ms of flow control taking its place.
Where it’s stronger: you got -25.4% at 64 sessions versus my -14.8%. Your ON runs hit 26,400 rows/sec against my 24,500, while the OFF side matched. My 64-session runs pushed 1.6M rows through twice as many client sqlcmd processes for twice as long, so I was probably eating more client-side CPU contention than you were. Your figure is likely the cleaner one.
Where it’s genuinely new — the 8-session result. You got ON 11.1% slower, and critically OnFlowCtrlMs is 7,690 rather than the exact zero I measured. In my 8-session test the flow-control mechanism never activated at all; in yours it did. That is the more interesting outcome, because it shows the feature turning on and then charging you for it: latch wait actually fell slightly (125,834 → 112,238) yet elapsed time rose. You paid the throttle without getting enough contention relief back.
One caveat before treating that as settled: with -Rounds 2, an 11% gap at 8 sessions is within plausible run-to-run variance, and the combined wait numbers (119,928 ON vs 125,834 OFF) don’t obviously explain an 11% slowdown. That mismatch suggests some of it is noise or CPU overhead these three counters don’t capture.
Some background in a lock and a latch.
A lock protects logical data — a row, page, or table — for the duration of a transaction, to give you isolation guarantees. A latch protects a physical in-memory structure — usually an 8 KB page in the buffer pool — for the duration of a single physical operation, to stop two threads corrupting the same bytes at once.
| Lock | Latch | |
| Protects | Logical data, transactional consistency | Physical memory structures |
| Duration | Until transaction commits (for X) | Microseconds — the operation itself |
| Managed by | Lock manager | Storage engine, internal |
| Visible in | sys.dm_tran_locks | Wait stats, sys.dm_os_latch_stats |
| Deadlock handling | Full graph detection, victim chosen | Timeouts (error 845/846), not the same machinery |
| Tunable by | Isolation level, hints, READCOMMITTEDLOCK | Nothing you can hint |
| Escalation | Row → page → table | None |
There’s actually a three-tier hierarchy by weight:
- Spinlock — lightest. Thread busy-spins on CPU rather than yielding. For structures held nanoseconds.
- Latch — middle. Thread yields the scheduler and registers a wait.
- Lock — heaviest. Full bookkeeping, owner lists, deadlock graph, escalation.
So “lightweight lock” is fair for the cost, but misleading about the purpose. A latch isn’t a cheaper way to do isolation; it’s a different job. Locks exist because you need transactional correctness. Latches exist because the engine needs memory safety, and they’d be there even in a database with no transactions at all.
This is exactly what we measured. Those 64 sessions were inserting different rows, so their row locks never conflicted — sys.dm_tran_locks would have shown nothing interesting, and there was no blocking in the usual sense. But every one of them had to physically write into the same trailing 8 KB page, and only one thread can hold PAGELATCH_EX on a page at a time. Fully serialized on a structure the lock manager knows nothing about.
That’s what makes last-page contention confusing to diagnose: all the normal blocking indicators are clean. Two practical consequences:
- NOLOCK / READ UNCOMMITTED does nothing for it. Those change lock behavior; latches are taken regardless of isolation level. People reach for it and are baffled when throughput doesn’t move.
- The classic tempdb allocation bottleneck is the same phenomenon — PAGELATCH_UP on PFS/GAM/SGAM pages, not a locking problem at all.
OPTIMIZE_FOR_SEQUENTIAL_KEY only made a measurable difference at 64 sessions, and even there it was modest. At 1 and 8 sessions the differences are within run-to-run noise.
| Sessions | OFF | ON | Change | Latch waits OFF → ON |
| 1 | 10.6 s | 10.3 s | −3.2% | none |
| 8 | 18.4 s | 18.7 s | +1.2% | 97.7 s → 96.5 s |
| 64 | 30.0 s | 28.2 s | −6.0% | 1,530 s → 1,150 s (−25%) |
1 session: there’s no contention, so the setting has nothing to do. The −3.2% most likely comes from OFF round 1 running first on a cold cache: its round 2 (10.2 s) is as fast as ON.
8 sessions: there’s real latch contention, but it’s the same with the setting on or off, and flow control never kicked in (0 ms). With 8 sessions on 64 schedulers, the waits never pile up enough for SQL Server to throttle anything.
64 sessions: this is the only level where the setting did something, and it held up across both rounds: ON took 28.3 and 28.1 s, OFF took 31.0 and 29.0 s.
- Latch waits went down: time spent on page latch waits dropped by about 380 s.
- Some of that became throttling: about 211 s of BTREE_INSERT_FLOW_CONTROL waits appeared instead. That wait is the setting at work: it holds sessions back instead of letting them all fight over the last page.
- The net effect: total waiting fell by about 11% (1,530 s down to 1,361 s), which gave the 6% faster run.
Where the real cost is: throughput drops from 72,000 rows/sec with 1 session to 43,000 with 8 and 26,000 with 64. More sessions insert fewer rows per second in total. At 64 sessions the latch waits add up to about 1,530 s in a 30 s run, which means on average roughly 50 of the 64 sessions are waiting on the last page at any moment. The setting only takes a little off that. To really fix last-page contention you need a key that doesn’t always insert at the end, such as a hash-partitioned table or a non-sequential key, or fewer concurrent writers.
Flow control only really kicks in once sessions far outnumber schedulers. Your server has 64, so the 64-session test only just reached that point. If you want to see a clearer effect, the next run would be:
Next on the fast machine win11
pwsh -File C:\Claude\Test-SequentialKey.ps1 -ThreadCounts 64,128,256 -Rounds 2
And it’s why OPTIMIZE_FOR_SEQUENTIAL_KEY had to be a new mechanism rather than a lock hint. There was no existing knob, because the contention was never in the lock manager.
One related distinction worth keeping straight, since both showed up in your dashboard: PAGELATCH_* means the page is already in memory and you’re waiting on another thread. PAGEIOLATCH_* means the page is being read from disk and you’re waiting on storage. Same latch, very different problem — the first is a concurrency issue, the second is an I/O issue.
OPTIMIZE_FOR_SEQUENTIAL_KEY only speeds up inserts when many sessions fight over the latch on the same last page: on WIN10 it made 64 sessions 15–25% faster, made a single session about 3% slower, and may have slowed 8 sessions by about 11% (not confirmed yet). StackOverflow2013’s real workload has no such contention, so enable it only where PAGELATCH_EX wait stats show the problem.
On this server, OPTIMIZE_FOR_SEQUENTIAL_KEY doesn’t do much. It’s harmless and gives a small gain under heavy concurrency, but it won’t fix a last-page contention problem.
- Low concurrency: no effect. With 1 and 8 sessions the results were within ±3%, which is noise. Flow control never engaged. If the workload has fewer concurrent inserters than schedulers, the setting does nothing.
- High concurrency: a small but consistent gain. At 64 sessions both rounds were faster with the setting on, by 6% overall, and latch waits fell by 25%. Part of that saving shows up as flow-control waits instead, because the setting works by queuing sessions. It doesn’t take the contention away.
- It costs nothing to turn on. ON was never meaningfully slower at any level, so there’s little risk in enabling it on hot IDENTITY or sequential keys. That fits with Microsoft’s own advice.
- Most of the cost is still there. Throughput fell from 72,000 to 26,000 rows/sec going from 1 to 64 sessions, and the setting won back about 6% of that. If last-page contention really hurts, you need a design change: hash partitioning, a non-sequential key, batching inserts, or fewer concurrent writers.
In short: enable it on tables that take many concurrent inserts on a sequential key, since there’s no downside. Just don’t expect big gains from it.
Two caveats: this is one test on one server with narrow rows, and 64 sessions only just matches its 64 schedulers. A run at 128 and 256 sessions would show whether the gain grows once sessions clearly outnumber schedulers, which would make a stronger conclusion for your blog.
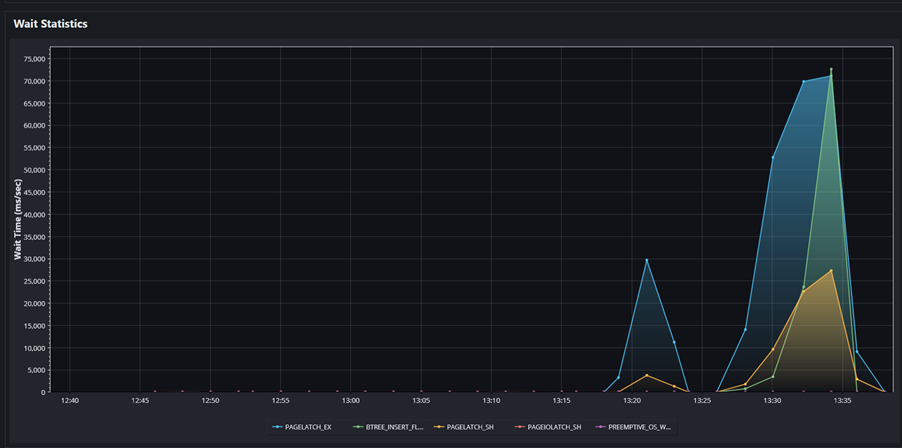
I’ve started the test on win11 in the background: 64, 128 and 256 sessions, 2 rounds each, 800,000 rows per run. That’s 12 runs, which should take roughly 5 to 10 minutes. It saves the full results to a CSV so no columns get cut off. I’ll report back when it finishes.
The run at 128 and 256 sessions changes my conclusion. Once there are more sessions than the server’s 64 schedulers, the setting makes a big difference.
| Sessions | OFF | ON | Change | Rows/sec OFF → ON | Latch waits OFF → ON | Flow-control waits (ON) |
| 64 | 29.7 s | 29.0 s | −2.5% | 26,900 → 27,600 | 1,512 s → 1,149 s | 253 s |
| 128 | 39.7 s | 30.4 s | −23.4% | 20,100 → 26,300 | 4,015 s → 1,416 s | 1,551 s |
| 256 | 48.3 s | 31.5 s | −34.7% | 16,600 → 25,400 | 7,653 s → 1,551 s | 4,285 s |
Both rounds agreed at every level. For example, at 256 sessions OFF took 49.5 and 47.1 s, and ON took 31.7 and 31.4 s.
What the numbers show:
- ON holds throughput steady. With ON, the run took 29 to 31.5 s and inserted about 25,000 to 27,000 rows/sec, whether there were 64, 128 or 256 sessions. With OFF, adding sessions kept making it slower: 29.7 s, then 39.7 s, then 48.3 s, down to about 16,600 rows/sec.
- Latch waits stop growing. With OFF, latch waits grew roughly in line with the session count: 1.5 million ms, then 4.0 million, then 7.7 million. With ON they stayed near the 64-session level (about 1.1 to 1.6 million ms), no matter how many sessions were added.
- The waiting doesn’t go away, it gets organised. At 256 sessions ON still spent about 5,800 s waiting in total (latch plus flow-control waits), against about 7,700 s with OFF. The gain isn’t mainly less waiting. With OFF, sessions keep piling onto the last page and fighting over it. With ON, flow control lets through only about as many sessions as there are schedulers, and the rest wait their turn. The runs this session gave −6% and −2.5% at 64 sessions, which is roughly where that tipping point is.
- It doesn’t raise the ceiling. A single session still inserts about 72,000 rows/sec, against about 25,000 with the setting on at high concurrency. The setting stops the problem from getting worse; it doesn’t take it away.
Revised conclusion:
- Fewer concurrent inserters than schedulers: no measurable effect. It’s harmless, but it doesn’t help.
- More concurrent inserters than schedulers: a big win. It was 23% faster at 2× the scheduler count and 35% faster at 4×, and throughput stayed flat instead of dropping.
- Recommendation: turn it on for tables with a sequential key (IDENTITY, SEQUENCE, datetime) that can get bursts of concurrent inserts. There’s no downside at low concurrency, and it protects you when a burst hits. For more throughput than about 25,000 rows/sec, the key design itself has to change.
Two caveats: these are narrow rows with 100 inserts per commit on one server (SQL Server 2025, 64 schedulers), and each session was a separate sqlcmd process. With wider rows or single-row commits, WRITELOG waits play a bigger part and the gap will probably be smaller.