

Ola Hallengren does a great job with his IndexOptimize ( SQL Server Index and Statistics Maintenance ). .
Discussion note from working through Jeff Moden’s ( (10) Jeff Moden | LinkedIn ) “Black Arts Index Maintenance #1.2 – GUIDs v.s. Fragmentation” deck alongside, should Ola do a rebuild on randomness, should we implement 2 Index Maintenance Jobs (one random, one serial). The 5/30 recommended setting told by Mr. P. Randall are depending on.. insert speed, page splits, locking, AG’s hardening their transaction logs escalation in table locks in production.. do still like your DBA job. Lets learn and visualize it.
Here on Github ( ronaldgithub/SQLIndexVisualizer: Shows index page information for better index maintenance instead of the 5 / 30 page level settings. )
If you want a deeper dive Undergraduate Upends a 40-Year-Old Data Science Conjecture | Quanta Magazine . In my words, packing a parking space full is sometimes not what you want, leaving some empty spaces make it much easier if want to do shopping instead of driving around in circles an go home angry.
Lets have a look at two different primary keys of a table, on sequential and one random.
-- INT Demo Code
DROP TABLE IF EXISTS dbo.GoodINT;
CREATE TABLE dbo.GoodINT
(
  SomeInt INT IDENTITY(1,1)
 , CONSTRAINT pk_goodint PRIMARY KEY CLUSTERED (SomeInt)
);

SET NOCOUNT ON;
DECLARE @Counter INT = 1;

WHILE @Counter <= 100000
BEGIN
	INSERT INTO dbo.GoodINT DEFAULT VALUES
	SELECT @Counter += 1
END
GOAnd looking at the metadata.
SELECT index_id
, index_level
, avg_fragmentation_in_percent
, avg_fragment_size_in_pages
, avg_page_space_used_in_percent
, SizeMB =  page_count/128.0
FROM sys.dm_db_index_physical_stats (DB_ID(),OBJECT_ID('dbo.GoodINT'),NULL,NULL,'DETAILED');

/*
index_id  index_level  avg_fragmentation_in_percent  avg_fragment_size_in_pages  avg_page_space_used_in_percent  SizeMB
1         0            0.6211180124223602             40.25                       99.73480355819126               1.257812
1         1            0                               1                           25.833951074870274             0.007812

Analysis:
Leaf level (index_level 0) sits at 99.73% page density with only 0.62%
fragmentation after 100,000 sequential inserts. An ever-increasing IDENTITY
key always inserts at the rightmost edge of the clustered index, so pages
fill up in order and are written once, back-to-back on disk - no random
insert ever lands on an already-full page elsewhere in the tree, so there's
nothing to split. The only page below 100% is the current "hot" page at the
end of the leaf level, which is exactly what you'd expect mid-load.

The single non-leaf row (index_level 1) at 25.8% density is the root page -
its low fill % is irrelevant; root/intermediate pages are tiny relative to
the leaf and their density doesn't affect scan or seek performance the way
leaf density does.

This is the textbook "good" DNA pattern: uniform high density, near-zero
fragmentation, contrast this against BadGUID's random-GUID key, where each
insert lands on a random existing page, forcing constant 50/50 page splits
and driving density down and fragmentation up throughout the tree, not just
at one hot edge.
*/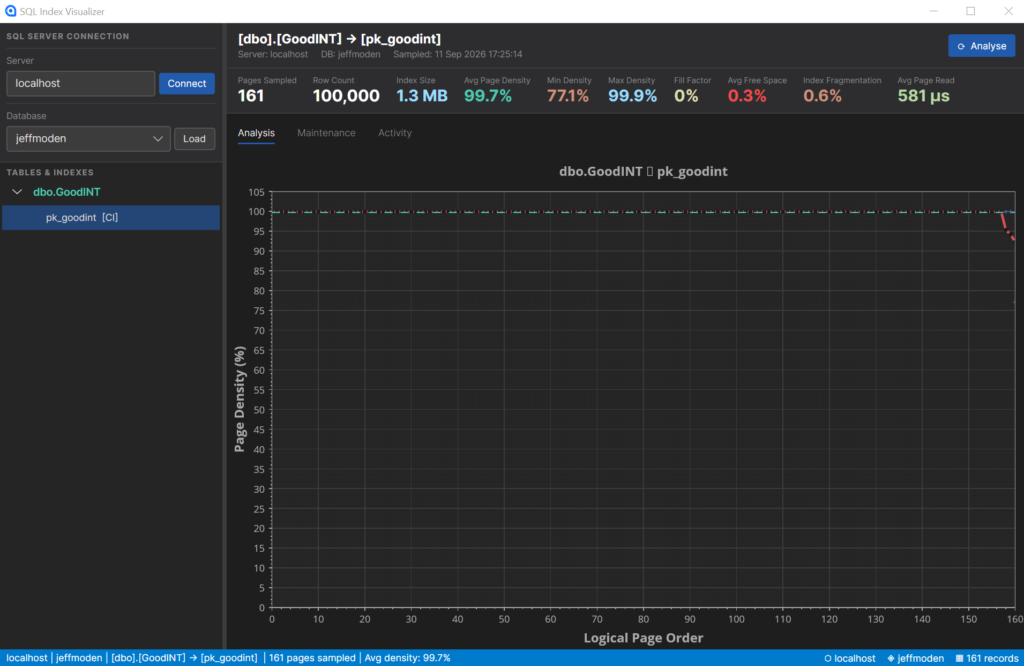
This is what you see.
/*
================================================================================
VISUAL PRIMER -- pages, fill level (density), and fragmentation
================================================================================

1) A PAGE is a fixed 8 KB slot. "Fill level" / "page density" = how much of
   that 8 KB is actually used by rows vs sitting empty.

     8 KB PAGE (100% full - GoodINT's normal leaf page)
     +--------------------------------------------------+
     | row | row | row | row | row | row | row | row |  |  <- ~0 free space
     +--------------------------------------------------+

     8 KB PAGE (50% full - right after a page split)
     +--------------------------------------------------+
     | row | row | row | row |                          |  <- ~50% free space
     +--------------------------------------------------+

   avg_page_space_used_in_percent is the average of this fill level across
   all pages. GoodINT = 99.73% -> pages are packed tight, almost no waste.

2) PAGE SPLIT: happens when a new row must go INTO a page that's already
   full. SQL Server allocates a new page and moves ~half the rows there.

     BEFORE (full page, new row must insert into the middle - BadGUID case)
     +-----------------+
     | A  B  C  D  ...H|   <- full, new row "D2" must go between D and E
     +-----------------+

     AFTER (split into two ~50% full pages)
     +----------+     +-------------+
     | A  B  C  D|---->| D2  E  F ...H|   <- 2 pages now, both ~50% full
     +----------+     +-------------+
       page 41            page 87         <- often NOT next to each other
                                              on disk!

   This is exactly what GoodINT avoids: an ever-increasing IDENTITY key
   never inserts "into the middle" of a page - it only ever appends to the
   last page, so nothing existing ever needs to split.

3) FRAGMENTATION: leaf pages are chained in logical key order (page 41
   points to the "next" page). Fragmentation = how often that NEXT logical
   page is NOT the physically next page on disk.

     NOT FRAGMENTED (GoodINT: 0.62%)          FRAGMENTED (BadGUID: high %)
     disk:   [P1][P2][P3][P4]                 disk:   [P1][P9][P3][P2]
     logical chain: P1->P2->P3->P4            logical chain: P1->P2->P3->P4
     (read-ahead streams straight              (each "next page" needs a
      through in physical order)                disk seek somewhere else -
                                                  kills range-scan speed)

   Sequential inserts write pages in order, so physical order matches
   logical order almost perfectly -> low fragmentation. Random-key inserts
   (BadGUID) allocate new pages wherever there's free space -> physical
   order scrambles relative to logical order -> high fragmentation.
================================================================================
*/
exec [dbo].[usp_IndexPageInfo] 'dbo.GoodINT'

/*
================================================================================
SAMPLE RUN -- exec [dbo].[usp_IndexPageInfo] 'dbo.GoodINT'
================================================================================
Result (161 sampled pages, PageSort 0-160):

  PageSort    PageDensity    PageRead
  0 .. 159    99.8764822     581       <- 160 pages, all identical
  160         77.0750988     581       <- the last page only

Analysis (for students):
160 of the 161 sampled pages sit at a near-identical 99.88% density. Under
a sequential IDENTITY key, once a page fills up it is never written to
again, so it stays packed forever. Page 160 - the very last page in key
order - is the one exception: it's the page currently accepting new rows,
so it's the only page ever caught mid-fill (77.08%).

This is the "last-page hot spot" pattern described in CLAUDE.md's DNA-chart
table: with an ever-increasing key, only the rightmost leaf page is ever
"in progress" - every other page is finished business and stays put.
Compare this to a random key (BadGUID): there, EVERY existing page is a
candidate for the next insert, so density stays uniformly lower and
fragmentation shows up across the whole table, not just at one tail page.
That's the whole reason sequential keys (IDENTITY) fragment so much less
than random keys (GUID) - see the page-split diagram above.

PageRead = 581 microseconds, identical for every sampled page, tells you
these pages were all pulled from disk together within this one DBCC PAGE
loop (a value of 0 would mean "already sitting in the buffer pool" - see
the VISUAL PRIMER above). Run the proc a second time right after and
expect PageRead to drop to 0 for most pages, since they're now warm in
memory.
================================================================================
*/Random
-- GUID Demo Code
DROP TABLE IF EXISTS dbo.BadGUID;
CREATE TABLE dbo.BadGUID
(
  SomeGuid UNIQUEIDENTIFIER DEFAULT NEWID()
 , CONSTRAINT pk_badguid PRIMARY KEY CLUSTERED (SomeGuid)
);

SET NOCOUNT ON;
DECLARE @Counter INT = 1;

WHILE @Counter <= 100000
BEGIN
	INSERT INTO dbo.BadGUID DEFAULT VALUES
	SELECT @Counter += 1
END
GOSELECT index_id
, index_level
, avg_fragmentation_in_percent
, avg_fragment_size_in_pages
, avg_page_space_used_in_percent
, SizeMB = page_count/128.0
FROM sys.dm_db_index_physical_stats (DB_ID(),OBJECT_ID('dbo.BadGUID'),NULL,NULL,'DETAILED');
/*
index_id index_level avg_fragmentation_in_percent avg_fragment_size_in_pages avg_page_space_used_in_percent SizeMB
1 0 98.99396378269618 1 62.12233753397578 3.882812
1 1 0 1 76.72967630343464 0.015625
1 2 0 1 0.5930318754633062 0.007812
Analysis:
Night-and-day difference from GoodINT. Leaf level (index_level 0) sits at
only 62.12% density with 98.99% fragmentation after the same 100,000
inserts. A random UNIQUEIDENTIFIER key (NEWID()) lands on a random existing
leaf page every single time, not just at the end of the table like an
IDENTITY does. Once that random page is full, SQL Server has to split it -
so nearly every page in the table has been split at least once, leaving
each one roughly half-empty and physically out of order relative to its
neighbors in the key chain. That's exactly what avg_fragmentation_in_percent
is measuring: 98.99% of pages are NOT followed on disk by their logical
next page.
Notice the table also needed a third b-tree level (index_level 2, the true
root) that GoodINT never needed - because pages are only ~62% full instead
of ~99.7% full, BadGUID needs roughly 1.6x as many leaf pages to hold the
same 100,000 rows (3.88 MB vs GoodINT's 1.26 MB, and that's even before
accounting for the wider 16-byte GUID key vs a 4-byte int), which pushes
the intermediate level past what a single root page can index directly.
index_level 1 here is a real, populated intermediate level (76.73% density)
- unlike GoodINT's index_level 1, which WAS the root and barely mattered.
index_level 2 (0.59% density) is now BadGUID's actual root page - still
just a handful of pointer rows, still not meaningful on its own.
This is the textbook "random hot spot" DNA pattern from CLAUDE.md: density
variable throughout, no spatial pattern, contrast this against GoodINT's
"last-page hot spot", where only the single rightmost page is ever
mid-fill and every other page stays packed. The fix Ola Hallengren's
IndexOptimize would apply here (>30% fragmentation) is REBUILD, not
REORGANIZE - REORGANIZE can compact pages back toward the fill factor, but
it can't stop the NEXT insert from splitting a different random page all
over again. The only real fixes are a sequential key, a lower fill factor
to absorb the churn, or accepting the maintenance cost.
*/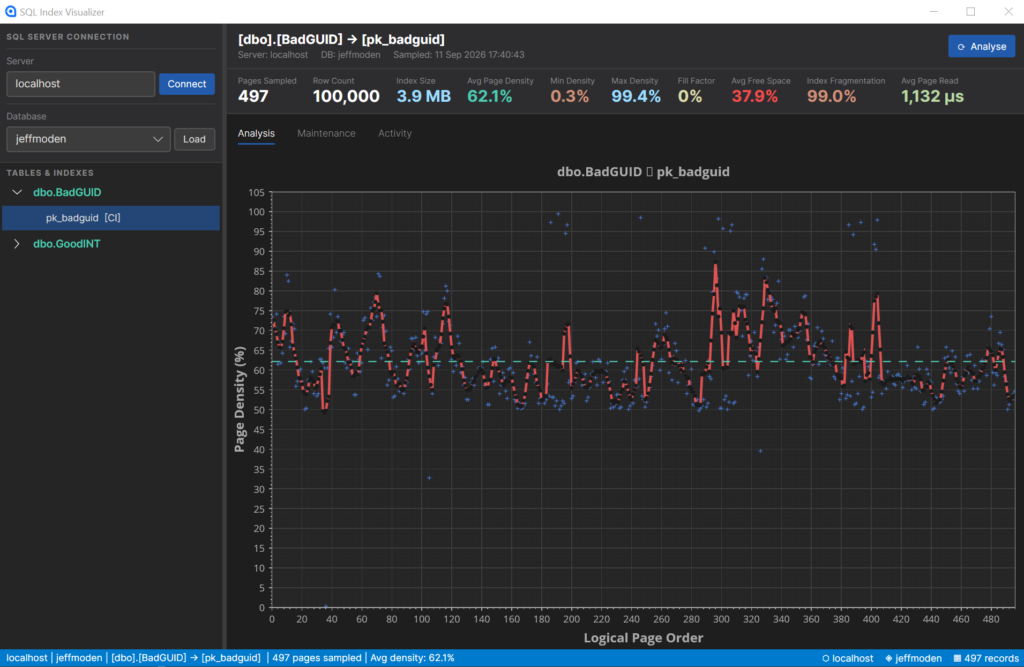
This what you see…
exec [dbo].[usp_IndexPageInfo] 'dbo.BadGUID'

/*
================================================================================
SAMPLE RUN -- exec [dbo].[usp_IndexPageInfo] 'dbo.BadGUID'
================================================================================
Result (497 sampled pages, PageSort 0-496):

  Min PageDensity   0.3087944    (PageSort 36  - a near-empty leftover page)
  Max PageDensity  99.4318181    (PageSort 191 - a rare, still-intact page)
  Typical range    ~50% - 70%    (the bulk of all 497 sampled pages)
  Average          ~62%          (matches the DMV's avg_page_space_used_in_percent
                                   of 62.12% for the leaf level almost exactly)
  PageRead              1132     (identical for every sampled page - see
                                   goodINT.sql's VISUAL PRIMER for what
                                   PageRead means)

Analysis (for students):
Compare this to GoodINT's sample run: there, 160 of 161 pages sat at an
IDENTICAL 99.88% and only the very last page dipped. Here, density jumps
around unpredictably from one PageSort to the next with no relationship to
position in the table - a page near the START (PageSort 36) can be almost
empty (0.31%) while a page in the MIDDLE (PageSort 191) can be almost full
(99.43%). That randomness IS the signature of a random clustered key: each
of the 100,000 NEWID() inserts could land anywhere in the tree, so every
page's "story" (how many times it has split, how recently, how full it
got before the next split hit it) is independent of its neighbors'.

The couple of pages sitting near 90-99% density (PageSort 191, 246, 298,
301, 306, 307, 385, 388, 393, 404...) aren't a "good" region - they're
just pages that haven't been hit by a split yet, purely by chance. Given
enough further random inserts, those pages would eventually get split
down to ~50% too. That's the core problem Ola Hallengren's REBUILD fixes
and REORGANIZE can't: REORGANIZE only compacts pages that already exist,
it can't stop tomorrow's random insert from splitting a page that looks
fine today.
================================================================================
*/
Comparing selection those tables.
-- ============================================================================
-- STATISTICS IO / TIME -- real read cost of a full clustered index scan
-- ============================================================================
-- COUNT(*) against a table with only a clustered index has no choice but to
-- scan every leaf page, so "logical reads" here IS the leaf page count.
-- Run this in SSMS with "Messages" selected (Ctrl+Shift+T shows the STATISTICS
-- TIME/IO grid in some SSMS versions) and paste the output back for the
-- side-by-side comparison against BadGUID's version of this same query.
SET STATISTICS IO ON;
SET STATISTICS TIME ON;

SELECT COUNT(*) AS TotalRows FROM dbo.GoodINT;

SET STATISTICS IO OFF;
SET STATISTICS TIME OFF;

/*
================================================================================
RESULT

Table 'GoodINT'. Scan count 1, logical reads 163, physical reads 0,
read-ahead reads 0, lob reads 0.
SQL Server Execution Times: CPU time = 0 ms, elapsed time = 16 ms.

Analysis (for students):
163 logical reads to scan all 100,000 rows - almost exactly the 161 leaf
pages plus the couple of non-leaf pages reported by the fragmentation
query earlier. Compare against BadGUID's 501 logical reads for the SAME
100,000 rows (see badGUID.sql): roughly 3x more pages SQL Server had to
touch, purely because BadGUID's pages are only ~62% full instead of
~99.7% full. Every one of those extra ~340 reads is real work - more
pages pulled into the buffer pool, more of the buffer pool spent caching
the same amount of data, less room left for everything else on the server.

Note physical reads = 0 - the table was already sitting in the buffer
pool from the earlier DBCC PAGE work, so this comparison is purely about
LOGICAL page-touch cost, not disk I/O. Don't read too much into the
elapsed time (16 ms here vs BadGUID's 8 ms) - for queries this small and
cheap, timing is dominated by noise (plan caching, momentary server load),
not real work. Logical reads is the number that's actually comparable and
repeatable between runs, and the one that scales: on a real multi-GB
table, this same ~3x gap in reads-per-scan is the difference between a
scan finishing in seconds vs feeling like forever.
================================================================================
*/
-- ============================================================================
-- STATISTICS IO / TIME -- real read cost of a full clustered index scan
-- ============================================================================
-- Same query as goodINT.sql's version, against BadGUID instead. COUNT(*) has
-- no choice but to scan every leaf page of the (only) clustered index, so
-- "logical reads" here IS the leaf page count - expect it to land close to
-- BadGUID's ~497 leaf pages vs GoodINT's ~161, even though both tables hold
-- exactly 100,000 rows. That gap IS the real-world cost of low page density:
-- more pages to read (and cache) for the same data.
SET STATISTICS IO ON;
SET STATISTICS TIME ON;
SELECT COUNT(*) AS TotalRows FROM dbo.BadGUID;
SET STATISTICS IO OFF;
SET STATISTICS TIME OFF;
/*
================================================================================
RESULT
Table 'BadGUID'. Scan count 1, logical reads 501, physical reads 0,
read-ahead reads 0, lob reads 0.
SQL Server Execution Times: CPU time = 15 ms, elapsed time = 8 ms.
Analysis (for students):
501 logical reads for the exact same 100,000 rows GoodINT covered in 163
(see goodINT.sql). That's the real, measurable cost of 62% average page
density instead of 99.7%: roughly 3x as many pages have to be read - and
cached - to return identical data. This is what Paul Randal's fragmentation
argument is actually about: not the percentage itself, but what it costs
in I/O and buffer pool pressure every single time this table gets scanned.
As with GoodINT, physical reads = 0 here (both tables were already warm in
the buffer pool), so this run isn't showing disk cost directly - on a
busier server, or right after a restart, BadGUID's extra ~340 pages would
mean ~340 extra physical disk reads too, not just extra cache lookups.
Also don't over-read the CPU/elapsed time gap (15 ms / 8 ms) - for queries
this cheap, timing noise dominates run to run; GoodINT's own elapsed time
(16 ms) was actually HIGHER despite doing 1/3 the logical reads, which is
exactly why logical reads - not wall-clock time - is the number worth
trusting here. On a real multi-GB table this same ~3x gap in reads-per-scan
is the difference between a scan finishing in seconds vs feeling like
forever, and it's why Ola Hallengren's IndexOptimize rebuilds indexes like
this one instead of leaving them alone.
================================================================================
*/Formula 1 in Madrid (Hup Maxi..) lets race..
-- ============================================================================
-- INDEX MAINTENANCE RACE: "Best Practice" vs "Low Threshold" REBUILD
-- ============================================================================
-- Modeled on Jeff Moden's "Black Arts Index Maintenance #1.2 - GUIDs v.s.
-- Fragmentation - They're not the problem... WE ARE!" (28 Jul 2021).
-- Source deck: Z:\Learning\2-Jeff Moden-Black Arts Index Maintenance - GUIDs
-- v.s. Fragmentation - They're not the problem... WE ARE\PowerPoint\
-- Black Arts Index Maintenance 1-2 - GUIDs vs Fragmentation - 60 Minute
-- Version (FINAL).pptx
--
-- THE ACTUAL CLAIM BEING TESTED (his, not the usual one):
-- Random GUIDs are not what causes runaway fragmentation. REORGANIZE is.
-- REORGANIZE compacts pages UP TO the fill factor but can never make space
-- ABOVE it - so once a random-key index's density creeps near the fill
-- factor, REORGANIZE gets "stuck": it keeps compacting, inserts keep
-- splitting pages, and the whole thing thrashes forever. His fix is "Low
-- Threshold Rebuilds": REBUILD ONLY, at just >1% fragmentation (never
-- REORGANIZE), which keeps a random-GUID index essentially flat for weeks.
--
-- IMPORTANT CONTEXT: our own goodINT.sql / badGUID.sql demo (single 100K-row
-- batch into an empty table, no ongoing usage, no maintenance) is literally
-- the "strawman" demo Moden calls out in his own slide 10 - our BadGUID
-- landed at 497 leaf pages, his strawman example was 474. Both are BELOW
-- his stated 1,000-page floor for index maintenance to even matter. This
-- script fixes that: wider rows (his slide 42 test table design), small
-- REPEATED batched inserts (simulating ongoing usage, not one big load),
-- and two competing maintenance policies running side by side.
--
-- SCALE: his real study ran 3.65 million rows over a simulated year. This
-- version is scaled down to finish in SSMS in a few minutes while keeping
-- the same shape - tune @BatchSize / @Iterations below if you want it
-- bigger or faster.
-- ============================================================================

USE jeffmoden;
GO
SET NOCOUNT ON;

-- ----------------------------------------------------------------------------
-- Two identically-shaped tables, one per maintenance policy. Row design
-- matches slide 42: GUID clustered PK + CHAR(100) "Fluff" column simulating
-- other real columns (~123 bytes/row including the 7-byte row header ->
-- ~65 rows/page, same math he used).
-- ----------------------------------------------------------------------------
DROP TABLE IF EXISTS dbo.BadGUID_BestPractice;
CREATE TABLE dbo.BadGUID_BestPractice
(
     SomeGuid UNIQUEIDENTIFIER NOT NULL DEFAULT NEWID()
    ,Fluff    CHAR(100)        NOT NULL DEFAULT REPLICATE('x', 100)
    ,CONSTRAINT pk_bestpractice PRIMARY KEY CLUSTERED (SomeGuid) WITH (FILLFACTOR = 80)
);

DROP TABLE IF EXISTS dbo.BadGUID_LowThreshold;
CREATE TABLE dbo.BadGUID_LowThreshold
(
     SomeGuid UNIQUEIDENTIFIER NOT NULL DEFAULT NEWID()
    ,Fluff    CHAR(100)        NOT NULL DEFAULT REPLICATE('x', 100)
    ,CONSTRAINT pk_lowthreshold PRIMARY KEY CLUSTERED (SomeGuid) WITH (FILLFACTOR = 81)
);
-- Fill factors match slide 81's "secret": use 71 or 81 for random GUID
-- indexes - the trailing "1" is a reminder to REBUILD at >1% fragmentation.
-- (BestPractice keeps a plain 80 since it isn't following that rule anyway.)

-- ----------------------------------------------------------------------------
-- Per-iteration log: what each policy's index looked like, and what (if
-- anything) was done about it.
-- ----------------------------------------------------------------------------
DROP TABLE IF EXISTS dbo.MaintenanceLog;
CREATE TABLE dbo.MaintenanceLog
(
     LogID       INT IDENTITY(1,1) PRIMARY KEY
    ,Policy      VARCHAR(20) NOT NULL
    ,Iteration   INT         NOT NULL
    ,RowsSoFar   INT         NOT NULL
    ,PageCount   BIGINT      NOT NULL
    ,FragPercent FLOAT       NOT NULL
    ,ActionTaken VARCHAR(20) NOT NULL
    ,ActionMs    INT         NOT NULL
    ,LoggedAt    DATETIME2   NOT NULL DEFAULT SYSDATETIME()
);

-- ============================================================================
-- THE RACE
-- ============================================================================
DECLARE
     @BatchSize   INT = 1000   -- rows inserted per iteration, per table
    ,@Iterations  INT = 300    -- iterations ("simulated batches of activity")
    ,@i           INT = 1
    ,@PageCount   BIGINT
    ,@FragPercent FLOAT
    ,@Action      VARCHAR(20)
    ,@StartTime   DATETIME2;

WHILE @i <= @Iterations
BEGIN
    -- Small batched insert each iteration (real trickle usage, not one big
    -- sorted/unsorted load). Both tables get their own independent random
    -- GUIDs - we are only varying the MAINTENANCE POLICY, not the insert
    -- pattern, so any divergence between the two is attributable to that.
    INSERT INTO dbo.BadGUID_BestPractice (SomeGuid, Fluff)
    SELECT NEWID(), REPLICATE('x', 100)
    FROM (SELECT TOP (@BatchSize) 1 AS x FROM sys.all_objects a CROSS JOIN sys.all_objects b) AS Numbers;

    INSERT INTO dbo.BadGUID_LowThreshold (SomeGuid, Fluff)
    SELECT NEWID(), REPLICATE('x', 100)
    FROM (SELECT TOP (@BatchSize) 1 AS x FROM sys.all_objects a CROSS JOIN sys.all_objects b) AS Numbers;

    -- ---- Policy A: "Best Practice" (Ola Hallengren defaults) ----
    -- <5% nothing | 5-30% REORGANIZE | >30% REBUILD @ FILLFACTOR 80
    -- Uses 'LIMITED' mode - the same fast, non-leaf-scan mode Ola's
    -- IndexOptimize actually uses (see CLAUDE.md's Ola thresholds section).
    SELECT @PageCount = page_count, @FragPercent = avg_fragmentation_in_percent
    FROM sys.dm_db_index_physical_stats(DB_ID(), OBJECT_ID('dbo.BadGUID_BestPractice'), 1, NULL, 'LIMITED')
    WHERE index_level = 0;

    SET @Action = 'NONE';
    SET @StartTime = SYSDATETIME();
    IF @FragPercent > 30
    BEGIN
        ALTER INDEX pk_bestpractice ON dbo.BadGUID_BestPractice REBUILD WITH (FILLFACTOR = 80);
        SET @Action = 'REBUILD';
    END
    ELSE IF @FragPercent >= 5
    BEGIN
        ALTER INDEX pk_bestpractice ON dbo.BadGUID_BestPractice REORGANIZE;
        SET @Action = 'REORGANIZE';
    END;

    INSERT INTO dbo.MaintenanceLog (Policy, Iteration, RowsSoFar, PageCount, FragPercent, ActionTaken, ActionMs)
    VALUES ('BestPractice', @i, @i * @BatchSize, @PageCount, @FragPercent, @Action, DATEDIFF(MILLISECOND, @StartTime, SYSDATETIME()));

    -- ---- Policy B: "Low Threshold Rebuild" (Moden's fix) ----
    -- >1% REBUILD @ FILLFACTOR 81, NEVER REORGANIZE.
    SELECT @PageCount = page_count, @FragPercent = avg_fragmentation_in_percent
    FROM sys.dm_db_index_physical_stats(DB_ID(), OBJECT_ID('dbo.BadGUID_LowThreshold'), 1, NULL, 'LIMITED')
    WHERE index_level = 0;

    SET @Action = 'NONE';
    SET @StartTime = SYSDATETIME();
    IF @FragPercent > 1
    BEGIN
        ALTER INDEX pk_lowthreshold ON dbo.BadGUID_LowThreshold REBUILD WITH (FILLFACTOR = 81);
        SET @Action = 'REBUILD';
    END;

    INSERT INTO dbo.MaintenanceLog (Policy, Iteration, RowsSoFar, PageCount, FragPercent, ActionTaken, ActionMs)
    VALUES ('LowThreshold', @i, @i * @BatchSize, @PageCount, @FragPercent, @Action, DATEDIFF(MILLISECOND, @StartTime, SYSDATETIME()));

    SET @i += 1;
END;

-- ============================================================================
-- SUMMARY -- run after the loop finishes
-- ============================================================================
;WITH LastIteration AS
(
    SELECT Policy, MaxIter = MAX(Iteration)
    FROM dbo.MaintenanceLog
    GROUP BY Policy
)
SELECT
     ml.Policy
    ,MaintenanceActions = SUM(CASE WHEN ml.ActionTaken <> 'NONE' THEN 1 ELSE 0 END)
    ,ReorganizeCount     = SUM(CASE WHEN ml.ActionTaken = 'REORGANIZE' THEN 1 ELSE 0 END)
    ,RebuildCount        = SUM(CASE WHEN ml.ActionTaken = 'REBUILD' THEN 1 ELSE 0 END)
    ,TotalMaintenanceMs  = SUM(ml.ActionMs)
    ,AvgFragPercent      = AVG(ml.FragPercent)
    ,MaxFragPercent      = MAX(ml.FragPercent)
    ,FinalPageCount      = MAX(CASE WHEN ml.Iteration = li.MaxIter THEN ml.PageCount END)
    ,FinalFragPercent    = MAX(CASE WHEN ml.Iteration = li.MaxIter THEN ml.FragPercent END)
FROM dbo.MaintenanceLog ml
JOIN LastIteration li ON li.Policy = ml.Policy
GROUP BY ml.Policy
ORDER BY ml.Policy;

/*
================================================================================
RESULT -- paste the summary SELECT's output here once the loop finishes.

Policy	MaintenanceActions	ReorganizeCount	RebuildCount	TotalMaintenanceMs	AvgFragPercent	MaxFragPercent	FinalPageCount	FinalFragPercent
BestPractice	159	146	13	53868	8.1595073381059	96.0526315789474	5865	6.39386189258312
LowThreshold	46	0	46	4969	2.68436806303802	97.5609756097561	5513	0.126972610194087

Analysis (for students):
Both policies received the exact same 300,000 rows over the same 300
iterations. Only the MAINTENANCE POLICY differed - and the outcome is
stark:

  BestPractice: 159/300 iterations (53%) triggered maintenance, and 146
  of those (92%) were REORGANIZE, not REBUILD. Despite "doing something"
  over half the time, average fragmentation across the whole run was
  8.16%, peaking at 96.05%, and it finished at 6.39% fragmentation using
  5,865 pages.

  LowThreshold: only 46/300 iterations (15%) triggered maintenance, and
  EVERY one was a REBUILD - REORGANIZE was never used, by design. Average
  fragmentation was 2.68% (about a third of BestPractice's), and it
  finished at just 0.127% fragmentation using 5,513 pages - fewer pages
  than BestPractice despite BestPractice "compacting" via REORGANIZE 146
  times.

  Total time spent on maintenance: BestPractice spent 53.9 seconds across
  the whole run; LowThreshold spent 5.0 seconds - roughly 11x LESS
  maintenance time for a BETTER end result on every other metric.

This is Moden's core claim, reproduced end to end: REORGANIZE on a
random-key clustered index doesn't fix the underlying problem, it just
compacts pages back down toward the fill factor, which immediately
invites the next page split the moment another random insert lands
there. BestPractice's 146 REORGANIZEs mostly bought nothing - the table
kept re-fragmenting between them, which is exactly why its AVERAGE
fragmentation stayed high even with "maintenance" running constantly.
LowThreshold's lesson isn't "less maintenance is better" - it's "the
RIGHT maintenance, applied early and cheaply, beats frequent maintenance
that never actually fixes anything."

One number worth a caveat: LowThreshold's MaxFragPercent (97.56%) is
actually slightly higher than BestPractice's (96.05%). That's a single
outlier reading, not a sustained state - most likely from very early in
the run when the table was still tiny (a handful of pages), where
'LIMITED' mode's fragmentation estimate is known to be noisiest on small
page counts. Worth confirming by running the full-trajectory query below
and checking where that spike actually falls. Either way, AVERAGE
fragmentation, total maintenance time, and final fragmentation all point
the same direction, so one early spike doesn't change the conclusion.

What to look at next: run the commented-out full-trajectory query below
and chart both policies' FragPercent over Iteration - that's the shape of
Moden's "jagged sawtooth vs clean flats" slides (47-52). You can also
point the SQLIndexVisualizer app itself at dbo.BadGUID_BestPractice and
dbo.BadGUID_LowThreshold now that they exist, to see their DNA charts
side by side.
================================================================================
*/

-- Optional: eyeball the full trajectory instead of just the summary -
-- this is the shape of Moden's slides 47-52 ("jagged sawtooth" for
-- Best Practice vs "clean flats" for Low Threshold).
-- SELECT Policy, Iteration, RowsSoFar, PageCount, FragPercent, ActionTaken
-- FROM dbo.MaintenanceLog
-- ORDER BY Policy, Iteration;
Discussion note from working through Jeff Moden’s “Black Arts Index Maintenance #1.2 – GUIDs v.s. Fragmentation” deck alongside the goodINT.sql / badGUID.sql / IndexMaintenanceRace.sql demos in this repo. Slide numbers reference that deck.
The question
Could a production table that sat at 0% fragmentation for years suddenly cause locking/blocking bad enough to stop the application — worse in an Availability Group — the moment an update pattern changed?
Why this is plausible
- Bad page splits are expensive precisely because of locking, not just space. Slide 22: a bad split is “4 to 43 times tougher on the log file” than a good one, and the pages involved aren’t released until the transaction commits — so a burst of them can genuinely block other queries, not just waste disk.
- The trigger is usually an “Expansive Update” — a row growing in place (
NULL→ a value, aVARCHARgetting longer) — hitting a region of the index that’s been sitting untouched and packed near 100% for a long time. Slide 72’s own test: just 333 expansive updates out of 10,000 rows was enough to devastate a supposedly well-maintained IDENTITY index (“IT ALL BLOCKS SELECTS!”, slide 18). A table stable for years is exactly the setup where a big batch job or a schema/data change can suddenly hit thousands of rows in the same already-full region at once. - AG makes it worse, but not for the reason people usually assume. The deck actually busts the opposite myth (slides 56, 61, 62) — it argues
REORGANIZEgenerates more cumulative log/AG traffic over time than occasionalREBUILDs. But a sudden storm of bad splits is still a spike in heavily-logged, lock-holding activity that has to replicate/harden to the secondary — so if that spike happens on a system that’s been quietly under-maintained for years, an AG (especially synchronous) would feel it as sudden replication lag and stalled commits, which matches “stopped the application.”
The takeaway
It’s less “not doing maintenance caused it” and more “not doing maintenance let the table’s risk of a bad-split storm sit unnoticed until some update pattern finally triggered it all at once” — which lines up with the deck’s own conclusion (slide 84) that going without maintenance forever isn’t actually safe, it’s just less actively harmful than doing it wrong (REORGANIZE) in the short term.
The “4 years without index maintenance” anecdote — confirmed, from the video
Not in the PPTX, but it’s in the companion video (Black Arts Index Maintenance 1.2 - Guids vs. Fragmentation | Jeff Moden [rvZwMNJxqVo].mp4, ~19:22 mark), transcribed locally to check.
What actually happened, per the talk: in January 2016, Moden hit a page split that cascaded all the way up to the root level of the clustered index’s B-tree. A root-level split blocks the entire table, not just range scans — inserts, updates, and deletes all stall, because none of the pages involved in that system transaction release until it commits. That incident is what led him to deliberately run a four-year experiment of doing no index maintenance at all afterward (he’s explicit that he doesn’t recommend doing that) — presumably the origin of the “No Index Maintenance” baseline used later in his fragmentation study.
Correction to the original guess in this note: the causality runs the other way from what we’d assumed. It wasn’t “years of neglect quietly building risk until an update pattern triggered a blocking storm” — it was “one bad root-level-split incident → he intentionally went 4 years with zero maintenance afterward, on purpose, as an experiment.” The general mechanism above (bad splits are heavily logged and lock-holding, expansive updates are a common trigger) is still accurate and still the right lens for the general failure mode being asked about — it just isn’t literally what happened in his own story.
On the AG angle specifically: no direct AG connection was mentioned for this particular incident. The transcript’s only AG reference is the general myth he busts elsewhere in the talk — that people avoid REBUILD because “it’s worse for AG/the log file,” which he refutes with the log-file data (see “Two Prevalent Myths,” slide 56). The AG-amplification reasoning in this note is sound in general (a root-level block is still a log-heavy, lock-holding event that would need to replicate/harden to a secondary), it’s just not something he explicitly ties to his own incident.
Should Ola Hallengren’s IndexOptimize branch its policy on key type (sequential vs. random)?
Given what IndexMaintenanceRace.sql demonstrated — that a uniform “Best Practice” REORGANIZE/REBUILD threshold is actively worse than a REBUILD-only “Low Threshold” policy on a random-key clustered index — the natural follow-up question is whether Ola’s script should behave differently depending on whether an index’s key is sequential (IDENTITY, ascending dates) or random (GUID, hash).
Yes, and Ola already supports doing this — no script modification needed. IndexOptimize accepts an @Indexes list plus per-call @FragmentationLevel1/@FragmentationLevel2 thresholds, so it can simply be invoked twice in the same maintenance job:
- Call 1 — default Best Practice thresholds (
@FragmentationLevel1 = 5,@FragmentationLevel2 = 30, i.e. REORGANIZE 5-30%, REBUILD >30%) targeted at@Indexes= the sequential-key indexes. - Call 2 —
@FragmentationLevel1set high enough that REORGANIZE never triggers (e.g. 100) and@FragmentationLevel2 = 1, so anything over 1% fragmentation goes straight to REBUILD, targeted at@Indexes= the random-key indexes. This reproduces the “Low Threshold” policy that won the race.
The catch: Ola’s procedure has no built-in way to detect “this key is random” — it only reacts to measured fragmentation, with zero notion of key type. The classification (which clustered indexes are GUID/hash-keyed vs. IDENTITY/sequential) has to be built and maintained manually, and the two @Indexes lists need to stay in sync as tables get added or redesigned.