

In the past you always tried to make queries faster by starting joining with the smallest table and end with the largest one, or visa versa, whatever you did.. you never got it very fast.. now lets take a closer look at it an try some different options and see what the impact is and what does AI say, next time will be a breeze for you!
Setting: StackOverfow2013 and this is the simple ‘base’ query.
SELECT u.DisplayName, b.Name, b.Date
FROM dbo.Badges b
JOIN dbo.Users u ON u.Id = b.UserId
WHERE b.Id BETWEEN 1 AND 5000
OPTION (RECOMPILE);The dbo.Badges table has 8.000.000 rows, the table has a UserId which links to the primary key of the dbo.Users table, nice, however..
select min(id) min_id
from dbo.Badges bGive zero rows because 82.946 is min id.
You want to know how the order of tables joining (build/probe or outer/inner) will have it’s affect on the execution plan (physical operator (inner, hash, merge)).
/* =========================================================================
JOIN ORDER (BUILD/PROBE, OUTER/INNER) & PHYSICAL OPERATOR SELECTION
=========================================================================
All queries below join a small, arbitrarily-bounded slice of Badges
(Id BETWEEN 1 AND 5000, out of a few million rows) against the full Users table. That size gap makes the "right" choice obvious to a human, which is exactly what makes it a good demo: we force each wrong answer with join hints and watch cost/memory grant get worse, then compare against the
optimizer's own free choice.
- Click the leftmost (SELECT) icon, press F4 -> "Estimated Subtree
Cost" and (on actual plans) "Memory Grant" info.
- Hover/click the Hash Match icon -> tooltip shows "Hash Keys Build"
vs "Hash Keys Probe".
Convention:
top input edge = build, bottom
input edge = probe.
- Hover/click the Nested Loops icon -> top input edge = outer, bottom
input edge = inner. The inner side's seek/scan operator will show a
high "Number of Executions" (actual plan) equal to the outer row count.
CAUTION: B2 (i.e. B5 below) and B4 (B7 below) deliberately force an
inefficient plan (large table driving/building).
Use the ESTIMATED plan (Ctrl+L) for those rather than running them
for real -- B7 in particular asks the engine to loop over the
entire Users table.
========================================================================
*/Some setup first.
/*
---------------------------------------------------------------------
SETUP: demo index (safe to re-run)
Gives Badges a sort order on UserId that matches the Users clustered index
order on Id, so the MERGE JOIN demo doesn't need an extra explicit Sort.
---------------------------------------------------------------------
*/
IF NOT EXISTS (SELECT 1
FROM sys.indexes
WHERE name = 'IX_Demo_Badges_UserId'
AND object_id = OBJECT_ID('dbo.Badges')
)
CREATE INDEX IX_Demo_Badges_UserId ON dbo.Badges(UserId);
GOB0 – Base line what the optimizer picks.
/*
----------------------------------------------------------------------
B0. FREE CHOICE: no hints -- see what the optimizer picks on its own.
Expect Nested Loops, Badges-slice driving (outer), Users probed via its
clustered PK.
This is the baseline to compare every forced variant to.
---------------------------------------------------------------------
*/
SELECT u.DisplayName, b.Name, b.Date
FROM dbo.Badges b
JOIN dbo.Users u ON u.Id = b.UserId
WHERE b.Id BETWEEN 1 AND 5000
OPTION (RECOMPILE);Save the execution plan and use Erik Darling (Data’s) Performance Studio, it is here erikdarlingdata/PerformanceStudio: Free, open-source SQL Server execution plan analyzer — cross-platform GUI + CLI with 30 analysis rules, missing index detection, SSMS extension. Built-in MCP server for AI-assisted plan review.
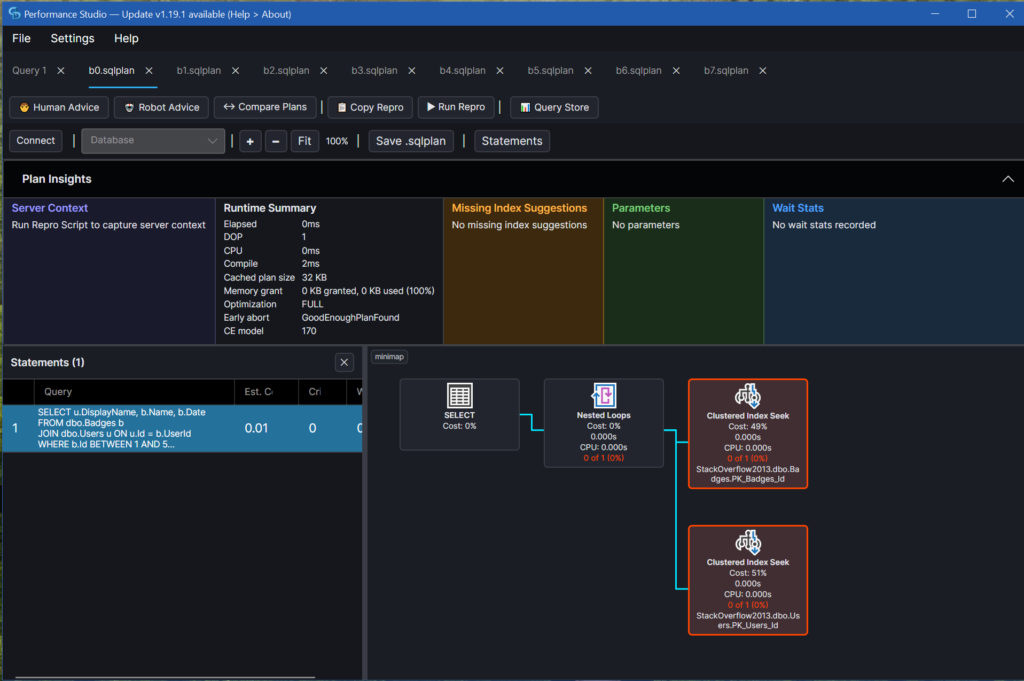
And lets ask what is the robot is thinking about and the logic of the nested loop short circuit.
Execution Plan Analysis — b0.sqlplan
Query:
SELECT u.DisplayName, b.Name, b.Date
FROM dbo.Badges b
JOIN dbo.Users u ON u.Id = b.UserId
WHERE b.Id BETWEEN 1 AND 5000
OPTION (RECOMPILE);This is an actual plan (runtime counters present), run serial (DOP 1), against StackOverflow2013.
What’s actually slow
Nothing is. Total query time is 0 ms elapsed / 0 ms CPU (QueryTimeStats), and every operator reports 0 ms self elapsed. There is no bottleneck to identify here — the query resolved in essentially no time and touched almost no data.
The reason: the Clustered Index Seek on dbo.Badges.PK_Badges_Id (node 1) seeking Id BETWEEN 1 AND 5000 returned 0 rows actual off just 3 logical reads. Badges.Id is an identity/PK column with 8,042,100 rows in the table, but apparently none of the surviving rows fall in the range 1–5000 (rows in that range have presumably been deleted over time, or IDs were reseeded). Because the outer side of the Nested Loops (Inner Join) (node 0) produced 0 rows, the inner probe against dbo.Users.PK_Users_Id (node 2) never executed at all — executions: 0. That’s correct, expected nested-loop short-circuiting, not a defect.
What I ruled out, and why
- Cost. The subtree cost of 0.01 is an estimate only; I didn’t use it to draw any conclusion — see the self-elapsed numbers above, which are all zero anyway.
- Cardinality estimation. Node 1 estimated 1 row/execution against an actual of 0. That’s not a meaningful skew (no ratio is computable off zero, and the absolute miss is negligible — 1 row). The digest’s skew check found nothing at or above 10x. With
OPTION (RECOMPILE), the optimizer compiled against the literal1/5000values and the histogram, so this is about as good an estimate as it could make for a range that turns out to be empty. - Missing indexes. None requested — both seeks already use their tables’ clustered (primary key) indexes directly, which is optimal for this access pattern.
- Memory grant. Granted/used memory are both 0 KB — nothing to investigate, no grant sizing issue.
- Parallelism/skew. Plan is serial (DOP 1); the parallelism skew checks don’t apply.
- Warnings. None present (no spills, no implicit conversions, no missing stats, no memory grant warnings).
Bottom line
This plan shows a well-formed, cheap point-lookup query that happens to hit an empty result range on Badges.Id. There is no rewrite or index change to recommend — the shape (seek → nested loop → seek, short-circuited when the outer side is empty) is exactly what you’d want for this predicate and join. If the intent was to test a populated ID range (e.g., to see the join actually execute against Users), the plan itself confirms that range 1–5000 currently has no matching Badges rows in this database.
B1 – Physical Operator – INNER LOOP
/*
----------------------------------------------------------------------
B1-B3: PHYSICAL OPERATOR SELECTION -- same logical query, operator forced
via join hint each time. Compare the SELECT operator's "Estimated Subtree
Cost" (F4 on the leftmost icon) across all three plus B0 above.
----------------------------------------------------------------------
B1. Force LOOP: should look close to B0's free choice and cost this is
    the operator the optimizer picked anyway
*/

SELECT u.DisplayName, b.Name, b.Date
FROM dbo.Badges b
INNER LOOP JOIN dbo.Users u ON u.Id = b.UserId
WHERE b.Id BETWEEN 1 AND 5000
OPTION (RECOMPILE);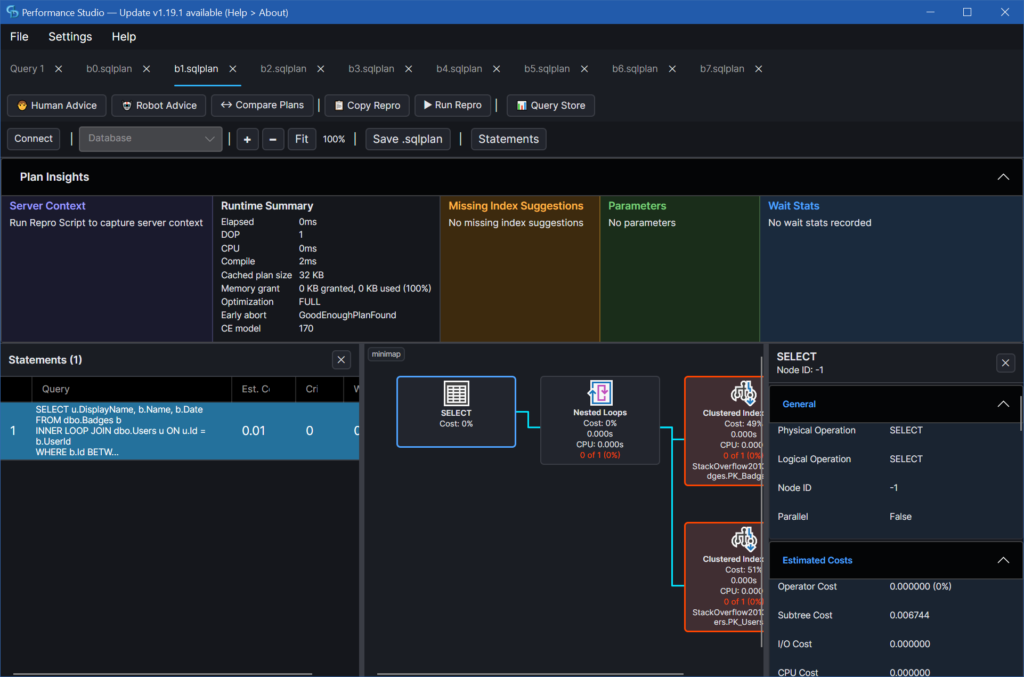
Execution Plan Analysis — b1.sqlplan
SELECT u.DisplayName, b.Name, b.Date
FROM dbo.Badges b
INNER LOOP JOIN dbo.Users u ON u.Id = b.UserId
WHERE b.Id BETWEEN 1 AND 5000
OPTION (RECOMPILE);Plan type
This is an actual plan (runtime stats present) captured on SQL Server build 17.0.1125.2 against the StackOverflow2013 database, CE model 170, optimized at FULL with early abort GoodEnoughPlanFound.
Bottom line: there is nothing to optimize here
The query did essentially no work and there is no performance problem to diagnose:
- Total query time: 0 ms elapsed, 0 ms CPU.
Clustered Index Seekondbo.Badges.PK_Badges_Id(node 1) soughtBadges.Idin the range[1, 5000], did 3 logical reads, and returned 0 rows — self elapsed 0 ms.- Because node 1 emitted 0 rows, the join’s inner side,
Clustered Index Seekondbo.Users.PK_Users_Id(node 2), never executed at all:executions = 0. - The
Nested Loops (Inner Join)(node 0) itself emitted 0 rows, 0 ms self elapsed.
There is no operator to rank by self time because none recorded any — the whole statement resolved off 3 logical reads with no rows to join.
Why zero rows
Badges.Id BETWEEN 1 AND 5000 matched nothing in this database’s Badges table, even though the table has an estimated cardinality of ~8,042,100 rows. That’s not evidence of a plan defect — it just means the Id values in the badges table on this instance don’t start at 1 (likely a much higher starting identity value, or the low end of the range was previously deleted). The seek itself is exactly right: Ordered=yes FORWARD, StartRange: Badges.Id GE (1), EndRange: Badges.Id LE (5000) — a well-formed range seek on the clustered PK, satisfied in 3 logical reads.
Cardinality check
Estimated 1 row/execution vs. actual 0 rows/execution on both seeks. That’s a trivial, harmless miss in the direction of “expected something, got nothing” — not the kind of order-of-magnitude misestimate that reshapes a plan. With OPTION (RECOMPILE) in effect, the estimate was already generated fresh for this exact predicate, so there’s no stale-statistics or parameter-sniffing story to tell either.
What I ruled out
- Missing indexes: none requested — both accesses are seeks on existing clustered primary keys.
- Warnings: none present (no spills, no implicit conversions, no memory grant issues).
- Memory grant: 0 KB requested/granted/used — a loop join over point-lookup seeks needs none.
- Parallelism: DOP 1 (serial) — irrelevant at this data volume, nothing to check for skew.
INNER LOOP JOINhint: appropriate here — one side is a narrow, highly selective range seek, the other is a PK point lookup; a loop join is the right shape even if it happened to run zero times.
Conclusion
Nothing in this plan is slow, and nothing needs fixing — the shape (clustered seek → loop join → clustered seek) is exactly what you’d want for this query pattern. If the expectation was that rows should come back, the next step isn’t plan tuning — it’s checking what Id values actually exist in dbo.Badges (e.g. SELECT MIN(Id), MAX(Id) FROM dbo.Badges) to see whether 1–5000 is a valid range for this table’s current contents.
B2 – Physical Operator – HASH
/*
B2. Force HASH: builds a hash table from one side and probes with the
other -- check the Hash Match operator's tooltip/properties for which
side became "Build" vs "Probe", and compare Memory Grant to B1 (which
needs none)
/*

SELECT u.DisplayName, b.Name, b.Date
FROM dbo.Badges b
INNER HASH JOIN dbo.Users u ON u.Id = b.UserId
WHERE b.Id BETWEEN 1 AND 5000
OPTION (RECOMPILE);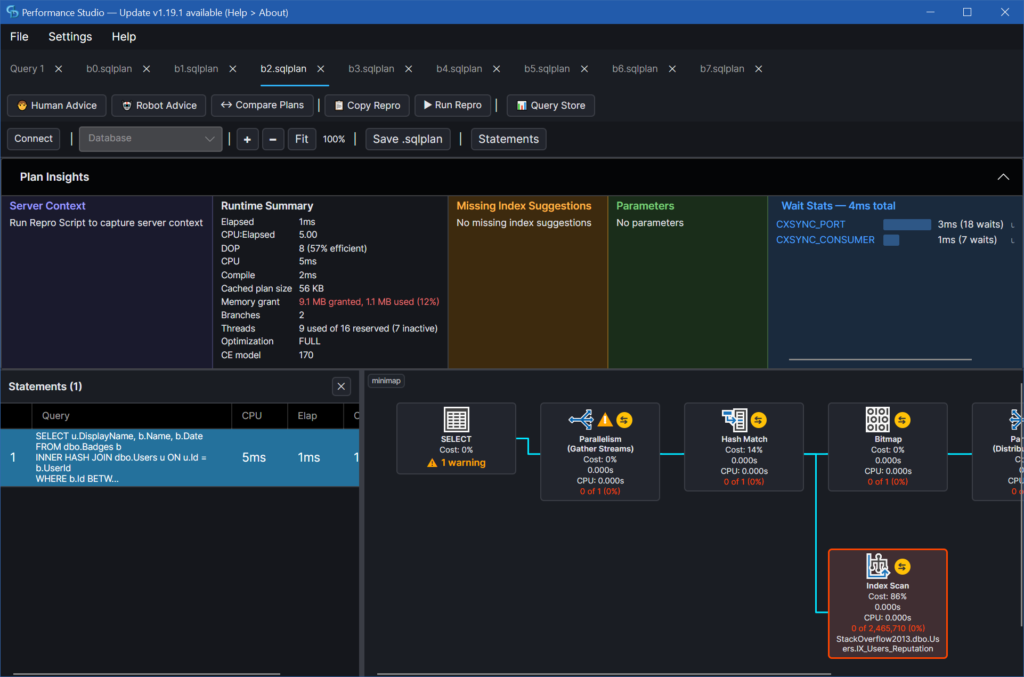
Execution Plan Analysis — b2.sqlplan
Query:
SELECT u.DisplayName, b.Name, b.Date
FROM dbo.Badges b
INNER HASH JOIN dbo.Users u ON u.Id = b.UserId
WHERE b.Id BETWEEN 1 AND 5000
OPTION (RECOMPILE);Bottom line: this query is not slow — it’s an actual plan with 1 ms elapsed / 5 ms CPU total, and it returned 0 rows. The Clustered Index Seek on Badges (node 4) for Id BETWEEN 1 AND 5000 produced 0 actual rows, so there was nothing for the hash join to do and nothing worth optimizing here. There is no bottleneck to chase in this plan.
Plan type and shape
- Runtime stats present → actual plan (CE model 170,
OPTIMIZATION LEVEL FULL,OPTION (RECOMPILE)forces a fresh, non-cached compile using sniffed literal values). - Shape:
Gather Streams→Hash Match (Inner Join)→ build sideBitmap Create←Distribute Streams←Clustered Index SeekonBadges.PK_Badges_Id; probe sideIndex ScanonUsers.IX_Users_Reputation, filtered byPROBE([Bitmap1002], ...). - Degree of parallelism: 8. The optimizer chose this based on an estimated subtree cost of 10.30, which exceeded the cost threshold for parallelism (5 in my case) — that’s a decision made before anything ran, not evidence of an actual expensive query.
Why 0 rows came out
- Node 4 (
Clustered Index Seek,dbo.Badges.PK_Badges_Id): seek rangeBadges.Id GE(1)/LE(5000), estimated 1 row/execution, actual 0 rows, 3 logical reads, 0 ms. Whatever is indbo.Badgesin this database, no rows exist withIdbetween 1 and 5000 (e.g. the table’sIdvalues start higher, or that range was deleted/never seeded). - This is the build side of the hash join (it feeds
Bitmap Createat node 2). An empty build side means the bloom-filter bitmap has nothing in it. - Node 5 (
Index Scan,dbo.Users.IX_Users_Reputation), the probe side, is filtered by that bitmap (PROBE([Bitmap1002], Users.Id, '[IN ROW]')). Because the bitmap is effectively empty, the scan contributes 0 actual rows across all 8 threads too, even though it was estimated at 2,465,710 rows/execution (table cardinality = 2,465,710, i.e. the optimizer expected to scan the whole table). - Node 1 (
Hash Match (Inner Join)): 8 executions (one per parallel branch), 0 rows out, 0 ms self time everywhere.
So the “2,465,711×” overestimate on node 5 in the cardinality-skew check isn’t a stale-statistics problem to fix — it’s simply that the optimizer, at compile time, correctly guessed it might have to scan all of Users before finding out (via the runtime bitmap) that the Badges side was empty. There’s no per-execution semantic issue here (unlike a nested-loop inner-side estimate), it’s a hash join build/probe estimate that never got exercised because the actual data volume was zero.
Memory grant
- Requested/granted: 9,352 KB; max used: 1,096 KB → 11.7% of the grant used. This tracks directly from the same inflated row estimate on the
Usersscan feeding the hash join’s build-side sizing. It caused no spill and no wait (GrantWaitTime = 0), so it’s not impacting this execution — just worth knowing the grant is oversized relative to what the query actually needed, in case this shape runs frequently with a shared cached plan (thoughOPTION (RECOMPILE)here means it won’t be cached/reused).
Waits
CXSYNC_PORT3 ms /CXSYNC_CONSUMER1 ms — ordinary parallel-plan thread synchronization overhead at this scale, not a signal of a problem.
Warnings / missing indexes
- No warnings (no spills, no implicit conversions, no missing-statistics warnings).
- No missing index requests.
What I ruled out
- Not a cost problem: the 10.30 estimated subtree cost and the “2,465,710-row” scan estimate are pre-execution guesses; actual work done was zero rows end-to-end.
- Not a memory grant problem: grant was used at only 11.7%, no wait time, no spill.
- Not a parallelism/skew problem: all 8 worker threads report 0 rows / 0 ms — there’s no uneven distribution to diagnose because there was no data to distribute.
- Not a missing-index situation: the plan seeks
Badgeson its clustered PK directly and the optimizer’s own missing-index feature found nothing to request.
If the intent was to test/benchmark this query against a Badges.Id range that actually has data, the plan itself confirms the range 1–5000 yields nothing in this Badges table — that’s the fact worth chasing, not any operator in this plan.
B3 – Physical Operator – MERGE
/*
B3. Force MERGE: both inputs need to arrive in join-key order. Thanks to
IX_Demo_Badges_UserId and Users' clustered PK on Id, this should be a
genuine ordered merge with no extra Sort operator (verify there isn't
one in the plan -- if there is, the optimizer decided sorting was
cheaper than reading the new index, which is itself an interesting
result)
*/

SELECT u.DisplayName, b.Name, b.Date
FROM dbo.Badges b
INNER MERGE JOIN dbo.Users u ON u.Id = b.UserId
WHERE b.Id BETWEEN 1 AND 5000
OPTION (RECOMPILE);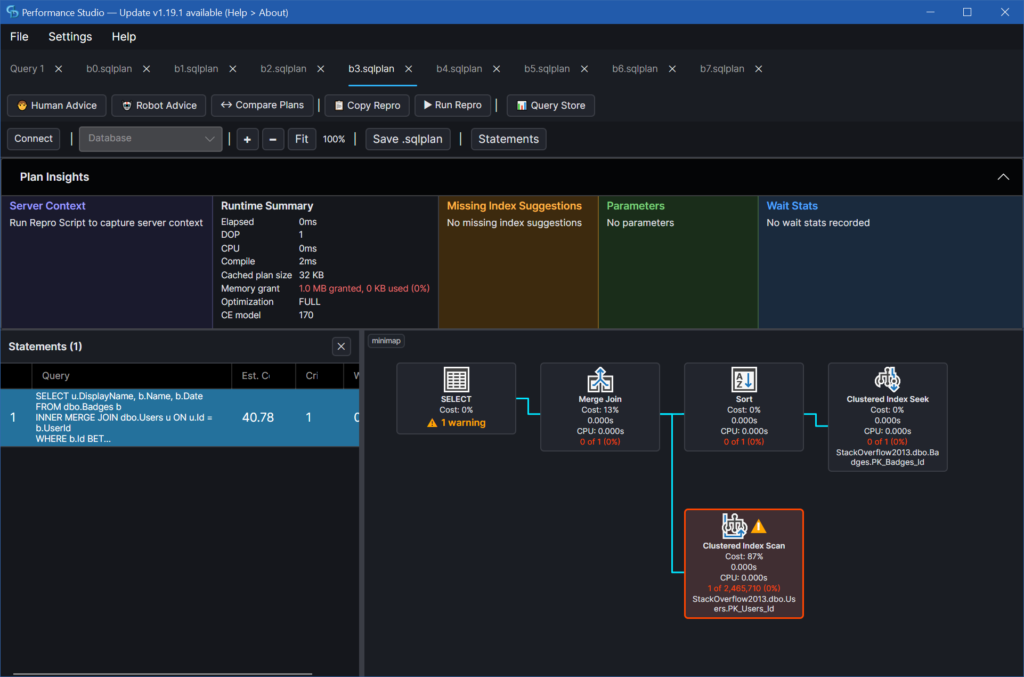
Execution Plan Analysis — b3.sqlplan
Query: SELECT u.DisplayName, b.Name, b.Date FROM dbo.Badges b INNER MERGE JOIN dbo.Users u ON u.Id = b.UserId WHERE b.Id BETWEEN 1 AND 5000 OPTION (RECOMPILE)
Bottom line: there isn’t one — this is an actual plan with QueryTimeStats reporting 0 ms elapsed / 0 ms CPU, and no operator recorded any nonzero self time. The query touched 8 logical reads total (3 on Badges, 5 on Users) and returned 0 rows. There is nothing here to optimize; the “40.78” cost figure at the top is an estimate only and, as usual, does not correspond to anything that actually happened.
Plan shape
[0] Merge Join (Inner Join)    est 1/exec  → actual 0 rows total
 [1] Sort                      est 1/exec  → actual 0 rows total
   [2] Clustered Index Seek dbo.Badges.PK_Badges_Id AS b
                               est 1/exec
                   → actual 0 rows total seek: Id >= 1 AND Id <= 5000
   [3] Clustered Index Scan dbo.Users.PK_Users_Id AS u
est 2,465,710/exec → actual 1 row- Serial plan, DOP 1, CE version 170, full optimization.
- The outer (first) input to the merge join is the Badges branch (seek + explicit Sort); the inner is the Users clustered index scan.
Why the Badges side needed a Sort
Merge join requires both inputs ordered on the join key (UserId/Id). The Badges seek on PK_Badges_Id returns rows ordered by Id, not UserId, so node 1 re-sorts the seek’s output by UserId before the merge. The Users side is already ordered by Id (the join key), so no sort is needed there — that’s why the plan is a Merge Join at all despite one side needing an extra sort operator.
The Badges seek (node 2) returned zero rows
Id BETWEEN 1 AND 5000 on PK_Badges_Id matched 0 actual rows (table cardinality 8,042,100), against an estimate of 1/exec. Whatever data currently exists in dbo.Badges, none of it falls in the Id range 1–5000. That’s a fact about the data in the connected database, not something visible from the plan’s shape — I can’t tell you why those IDs are absent (e.g., deleted rows, an identity gap, or a restored/subset copy of the table), only that the seek predicate is correct and the estimate (1 row) was already appropriately tiny, so this isn’t a cardinality problem worth chasing.
The 2.46M-row estimate on node 3 is not a real misestimate
Node 3 estimated 2,465,710 rows per execution (essentially the full Users table) but actually emitted only 1 row (rows READ = 1, 5 logical reads). This looks like a huge overestimate, but the mechanism is ordinary merge-join behavior, not a statistics problem:
- At compile time, the optimizer has to cost the Users scan as if it might need to walk the entire clustered index to satisfy the merge (it doesn’t know in advance that the outer side will be empty).
- At runtime, the sorted outer input (Badges) produced zero rows. A merge join detects end-of-input on one side and stops immediately — it opened the Users scan, read one row to attempt the first comparison, and then closed because there was nothing left on the outer side to match.
So the 2.4M vs 1 gap is explained by early termination, not by SQL Server guessing wrong about Users‘ row distribution. There’s no fix to apply here — the plan’s cost model (35.58 of the 40.78 total estimated subtree cost comes from this node) simply reflects a worst-case assumption that never materialized.
Warnings
- Memory grant flagged “Excessive Grant”: requested 1,024 KB, granted 1,024 KB, used 0 KB. This is the server’s minimum grant floor, not a real over-allocation — at 1 MB there’s nothing to reclaim and no other query is being starved by it. Not actionable.
- No spills, no implicit conversions, no missing-statistics warnings, no
<MissingIndexes>hints — both operators already seek/scan on their respective primary keys, so there’s nothing for the optimizer to ask for.
What I ruled out and why
- Cost-based conclusions (e.g. “node 3 is 87% of estimated cost, so it’s the problem”) — cost is always an estimate; here it’s also moot since the whole query ran in sub-millisecond time.
- The 2.46M/1 cardinality gap as a stats problem — explained by merge-join short-circuiting on an empty outer, not by bad statistics on
Users. OPTION (RECOMPILE)as relevant to any finding — the only predicate in the query (Id BETWEEN 1 AND 5000) is a literal, not a parameter, so RECOMPILE isn’t masking or revealing parameter sniffing here; it has no visible effect on this plan.- The memory grant warning as a real issue — 1 MB is the practical minimum; “excessive” here is a labeling artifact of the ratio, not a resource concern.
There’s no rewrite or index to recommend for this plan — it’s already as cheap as it can be, and the numbers say it finished instantly.
B4 – JOIN ORDER / BUILD-PROBE
/*
---------------------------------------------------------------------
B4-B7: JOIN ORDER / BUILD-PROBE / OUTER-INNER -- FORCE ORDER pins the
syntactic table order as the join order, so which table is listed first
determines which side becomes build (hash) or outer (loop). Flipping the
FROM clause order between each pair flips that role with nothing else
changed -- this isolates the "which side" decision from the "which
operator" decision above.
-----------------------------------------------------------------------
HASH, Badges-slice (small) listed first -> becomes the BUILD input.
Cheap: small hash table built, Users streamed through as the probe.
*/

SELECT u.DisplayName, b.Name, b.Date
FROM dbo.Badges b
INNER HASH JOIN dbo.Users u ON u.Id = b.UserId
WHERE b.Id BETWEEN 1 AND 5000
OPTION (FORCE ORDER, RECOMPILE);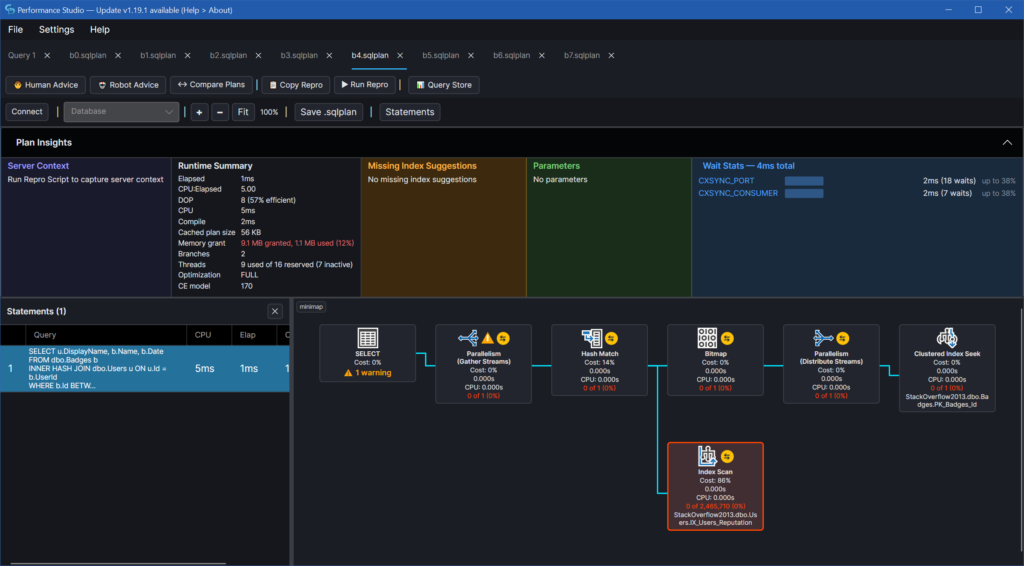
Analysis: b4.sqlplan
Nothing in this plan is slow. Total query time was 1 ms elapsed / 5 ms CPU (QueryTimeStats), and every operator in the tree reports 0 actual rows. There is no “where did the time go” question to answer here — the interesting story in this plan is why it returns zero rows so fast, and why it went parallel to do it.
The query
SELECT u.DisplayName, b.Name, b.Date
FROM dbo.Badges b
INNER HASH JOIN dbo.Users u ON u.Id = b.UserId
WHERE b.Id BETWEEN 1 AND 5000
OPTION (FORCE ORDER, RECOMPILE)
This is an actual plan (runtime stats present), compiled fresh (RECOMPILE), CE model 170, DOP 8.
What happened, operator by operator
- Node 4 — Clustered Index Seek,
PK_Badges_Id: seeksBadges.Idin[1, 5000]against a table of 8,042,100 rows. Estimated ~1 row; actual 0 rows, 3 logical reads. The estimate and the outcome agree (off by 1 row in absolute terms, not a meaningful skew) — the histogram correctly told the optimizer this range is essentially empty. This is a data fact (noBadges.Idvalues in1–5000currently exist), not a plan defect. - Node 2 — Bitmap Create: builds a bitmap (Bloom filter) from the join key values coming out of the Badges seek. Since that seek produced 0 rows, the bitmap is empty.
- Node 3/0 — Distribute Streams / Gather Streams: exchange operators moving the (empty) build side out to the parallel zone and gathering results back.
FORCE ORDERis what pinned Badges as the build/outer input here, feeding the bitmap before Users is touched. - Node 5 — Index Scan,
IX_Users_Reputation: a full, parallel (DOP 8,executions=8) scan of Users (2,465,710 rows), but every row is checked againstPROBE([Bitmap1002], Users.Id, ...). Because the bitmap is empty, every row is rejected — actual rows emitted: 0 across all 8 threads. - Node 1 — Hash Match (Inner Join): probes the (empty) hash table; 0 rows out.
So the semantic sequence is: seek Badges by ID range → build a Bloom filter from whatever UserIds come out → use that filter to prune the Users scan before it ever reaches the real hash-join probe → nothing survives, because nothing came out of the Badges seek in the first place. This bitmap semi-join pushdown is a genuine optimization (it lets SQL Server skip most of the Users scan’s join-probe cost when the bitmap is selective), and here it produced maximum benefit — an empty build side meant no Users row was worth passing on.
About the “2,465,711x overestimate” the digest flags
Node 5’s estimated 2,465,710 rows/exec vs. actual 0 is real, but it isn’t a costing mistake to fix. A Bitmap-filtered scan is always estimated as if it will read (and pass) the whole table, because the optimizer has no way to model the bitmap’s runtime selectivity at compile time — the filtering only exists once the build side has actually run. Don’t chase this one with a stats fix; there’s nothing wrong with the estimate for what it’s estimating.
Memory grant and waits — ruled out
- Granted 9,352 KB, used only 1,096 KB (11.7%). Over-granted, but at 1 ms total runtime this is not costing anything real; not worth tuning.
- Top waits are
CXSYNC_PORT/CXSYNC_CONSUMERat 2 ms each — ordinary parallel exchange synchronization overhead on a near-instant query, not evidence of a problem.
The one thing actually worth flagging: why did this go parallel at all?
DOP 8 for a query that returns zero rows looks odd until you remember: the decision to parallelize is made from the estimated serial cost (10.30, comfortably over the default “cost threshold for parallelism” of 5), before anything has run. An estimate of ~2.4M rows scanned on the Users side (node 5) is enough to justify DOP 8 on paper, even though the actual work turned out to be trivial. This is expected optimizer behavior given the estimates it had — not a bug, and not something RECOMPILE could have fixed, since the estimate was correct on the Badges side and the Users-side estimate is structurally decoupled from bitmap runtime selectivity (see above).
Bottom line
No index, rewrite, or hint change is indicated. The plan is fast (1 ms), the memory grant is oversized but harmless at this scale, and the shape (FORCE ORDER + INNER HASH JOIN building a bitmap from Badges to prune the Users scan) is doing exactly what it was written to do. If this file is being used to demonstrate bitmap semi-join pushdown, it’s a clean example: the bitmap suppressed the entire join-probe cost on the Users side because the build side (Badges in range 1–5000) turned out to be empty.
B5 – JOIN ORDER / BUILD-PROBE
/*
B5. HASH, same query, Users (large) listed first -> forced to become the
BUILD input instead. Same logical result, deliberately worse: the
optimizer now has to build a hash table sized for millions of Users
rows. Compare Memory Grant and Estimated Subtree Cost against B4.

>>> Use Ctrl+L (Estimated Plan) for this one, don't execute it. <<<
*/

SELECT u.DisplayName, b.Name, b.Date
FROM dbo.Users u
INNER HASH JOIN dbo.Badges b ON u.Id = b.UserId
WHERE b.Id BETWEEN 1 AND 5000
OPTION (FORCE ORDER, RECOMPILE);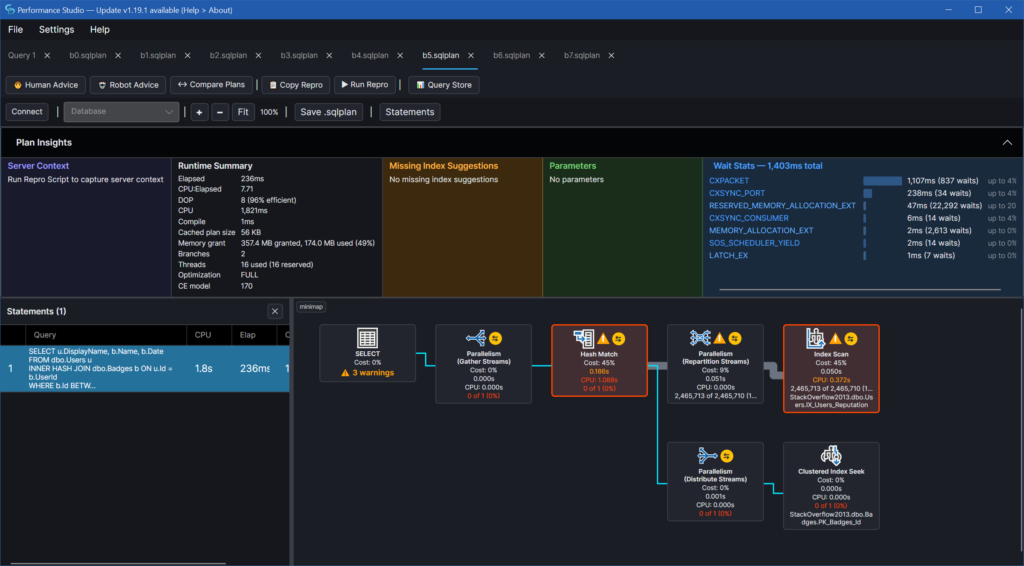
What’s slow, and why
The query runs in 236 ms elapsed (1,821 ms CPU, DOP 8), but almost all of that time is spent doing work that the query doesn’t need: building a hash table over the entire dbo.Users table.
- Node 1, Hash Match (Inner Join): 196 ms self elapsed (107 ms self CPU) — the single largest self-time consumer, ~83% of the query’s 236 ms total.
- Node 3, Index Scan on
dbo.Users.IX_Users_Reputation: 50 ms self elapsed, reading all 2,465,713 rows ofUsers(per-thread breakdown across 8 workers confirms even distribution — no skew, just genuinely all of it). - Node 2, Repartition Streams (exchange feeding the join): 51 ms self elapsed (exchange timings are unreliable in absolute terms, but the row count — 2,465,713 — confirms the full table crossed the exchange).
Meanwhile the other side of the join, Node 5, Clustered Index Seek on PK_Badges_Id (Badges.Id BETWEEN 1 AND 5000), is essentially free: 0 ms self elapsed, 3 logical reads, and it emitted 0 rows — nothing in Badges currently has an Id in that range. The whole query correctly returns 0 rows, but it paid the cost of a full scan-and-hash of Users to find that out.
Why the optimizer built the plan this way
The query has OPTION (FORCE ORDER, RECOMPILE) and an explicit INNER HASH JOIN. FORCE ORDER pins the join input order to the order written in the FROM clause (Users first, Badges second), and for a hash join the first input becomes the build side. So the optimizer was not permitted to reorder inputs — it was compelled to:
- Scan all of
Users(build input, node 3) and hash every row, even thoughUsershas no filter in theWHEREclause at all. - Seek
Badgesby the tightId BETWEEN 1 AND 5000filter (probe input, node 5) — the cheap, selective side — and use it only to probe.
Without the hints, the optimizer would very likely build the hash table from the small, filtered Badges result (≤5,000 rows by Id) instead, or — since Badges.Id seeks are this cheap and Users.Id is the clustered key — choose a nested loop join driven by Badges doing an index seek into Users.Id per row. Either alternative touches at most a few thousand rows of Users instead of 2.46 million.
What I ruled out
- Missing/stale statistics or a bad cardinality estimate: the digest reports no operator skewed ≥10× between estimate and actual (Node 3 estimated 2,465,710 rows and got 2,465,713 — an essentially exact estimate). This is not an estimation problem; the shape is correct given the forced order, it’s just the wrong shape for the workload.
- Memory grant: granted 365,960 KB, used 178,144 KB (48.7%) — oversized but not spilling and not the bottleneck.
- Parallelism/skew: DOP 8, and Node 3’s per-thread row counts (257,726–333,424) are evenly distributed — no skew, all 8 threads doing legitimate, necessary (if wasteful) work. The CXPACKET wait (1,107 ms across 837 waits) is threads at the exchange waiting on each other, a symptom of doing this much parallel work, not a distinct problem.
- Missing indexes: the plan carries no
<MissingIndexes>hint —IX_Users_Reputationis already covering the two output columns (Id,DisplayName) needed fromUsers, so index design isn’t the issue here.
Recommendation
Drop FORCE ORDER and the INNER HASH JOIN hint and let the optimizer choose the join order and algorithm freely. With Badges.Id BETWEEN 1 AND 5000 as a highly selective seek on the clustered PK, the optimizer should put Badges on the build/outer side and either hash- or loop-join into Users by Id, eliminating the full 2.46-million-row scan of Users (nodes 1–3’s combined ~297 ms of self time). If the hints exist to reproduce/demonstrate this exact pathology (e.g., as a “bad plan” test case), that’s a reasonable use — but they shouldn’t be in production code, since they force the optimizer into the more expensive shape regardless of how selective the Badges filter is at runtime. RECOMPILE is unrelated to this cost; it only prevents plan-cache reuse.
B6 – JOIN ORDER / BUILD-PROBE
/*
B6. LOOP, Badges-slice listed first -> becomes the OUTER input. Efficient: ~5000 outer iterations, each doing one clustered-index seek into Users.

SELECT u.DisplayName, b.Name, b.Date
FROM dbo.Badges b
INNER LOOP JOIN dbo.Users u ON u.Id = b.UserId
WHERE b.Id BETWEEN 1 AND 5000
OPTION (FORCE ORDER, RECOMPILE);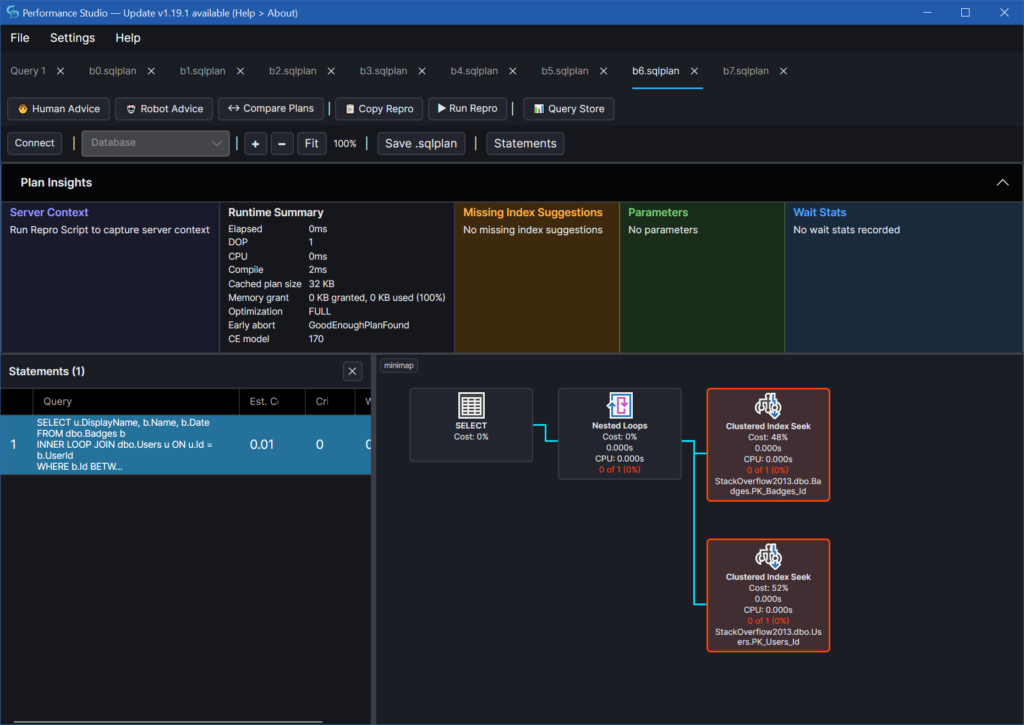
Execution Plan Analysis — b6.sqlplan
Bottom line: nothing here is slow. This is an actual plan (RunTimeInformation present, CE model 170, FULL optimization) whose QueryTimeStats reports 0 ms elapsed, 0 ms CPU for the whole statement. There is no operator to blame because there was effectively no work done — the plan is trivially cheap by measurement, not just by the (irrelevant) 0.01 estimated subtree cost.
Query
SELECT u.DisplayName, b.Name, b.Date
FROM dbo.Badges b
INNER LOOP JOIN dbo.Users u ON u.Id = b.UserId
WHERE b.Id BETWEEN 1 AND 5000
OPTION (FORCE ORDER, RECOMPILE);Serial plan, DOP 1. FORCE ORDER pins the join order to exactly what’s written (Badges outer, Users inner); RECOMPILE means this plan was built fresh for this one execution, not pulled from cache.
What actually happened, operator by operator
| Node | Operator | Object | Est rows/exec | Actual rows/exec | Executions | Self elapsed |
|---|---|---|---|---|---|---|
| 1 | Clustered Index Seek | dbo.Badges.PK_Badges_Id | 1 | 0 | 1 | 0 ms |
| 2 | Clustered Index Seek | dbo.Users.PK_Users_Id | 1 | 0 | 0 | 0 ms |
| 0 | Nested Loops (Inner Join) | — | 1 | 0 | 1 | 0 ms |
- Node 1 (outer input) seeks
Badges.Idin[1, 5000]— an equality/range seek on the clustered PK,Ordered=yes FORWARD, costing 3 logical reads. It ran once and returned zero rows. In this copy of the data (StackOverflow2013.dbo.Badges, cardinality 8,042,100), no badge exists withIdbetween 1 and 5000. - Node 2 (inner input, the
Usersseek onUserId) has 0 executions. A nested loop only drives its inner side once per outer row; since node 1 produced no outer rows, node 2 never ran at all. It isn’t “fast,” it simply never executed. - Node 0 (the join itself) therefore emits 0 rows and has 0 ms self elapsed.
What I ruled out
- Cardinality estimation: both seeks were estimated at 1 row/execution (the standard equality/point-lookup guess) against actual 0. The digest doesn’t flag this as skew, and it shouldn’t be treated as one — “estimated 1, got 0” from a range predicate that legitimately matches nothing is a data fact, not a stale-statistics problem.
- Memory grant:
GrantedMemory/MaxUsedMemoryare both 0 KB — nothing to investigate. - Parallelism/skew: plan is serial (DOP 1); not applicable.
- Missing indexes: none requested, and none would help — both seeks already hit the tables’ clustered primary keys, which fully cover the predicates.
- Warnings: none present (no spills, no implicit conversions, no missing-stats warning).
Takeaway
There’s no tuning opportunity in this plan — it’s already as cheap as a query can be, and it did essentially nothing because the Badges.Id BETWEEN 1 AND 5000 filter matched no rows in this database. If the expectation was that this range should return badges, that’s worth checking against the actual Id values in dbo.Badges (this looks like a Stack Overflow data-dump table where Badges.Id may not start near 1) — but that’s a question about the data, not about the plan.
B7 – JOIN ORDER / BUILD-PROBE
/*
B7. LOOP, same query, Users listed first -> Users is forced to be the
OUTER input, meaning one iteration (and one seek/scan against the
Badges index) per Users row -- millions of iterations instead of 5000.
Same result set, vastly different cost, purely from swapping outer/inner.

 >>> Use Ctrl+L (Estimated Plan) for this one -- do not execute it. <<<
*/

SELECT u.DisplayName, b.Name, b.Date
FROM dbo.Users u
INNER LOOP JOIN dbo.Badges b ON u.Id = b.UserId
WHERE b.Id BETWEEN 1 AND 5000
OPTION (FORCE ORDER, RECOMPILE);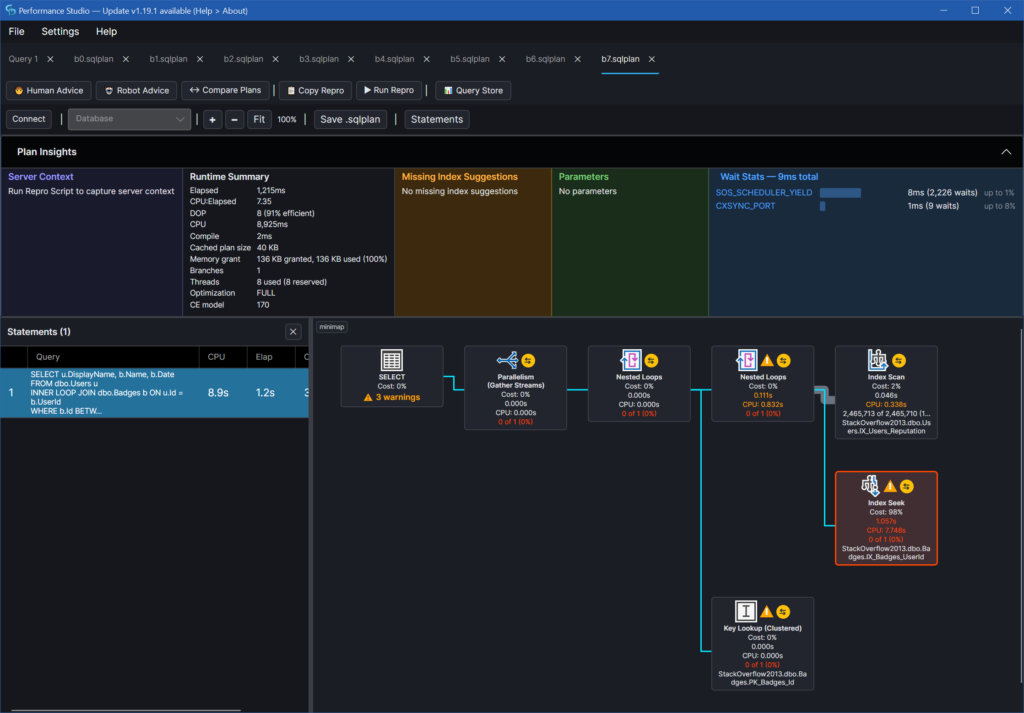
Execution Plan Analysis — b7.sqlplan
Query:
SELECT u.DisplayName, b.Name, b.Date
FROM dbo.Users u
INNER LOOP JOIN dbo.Badges b ON u.Id = b.UserId
WHERE b.Id BETWEEN 1 AND 5000
OPTION (FORCE ORDER, RECOMPILE)This is an actual plan (runtime stats present), DOP 8, total elapsed 1,215 ms / CPU 8,925 ms, estimated subtree cost 520.22 (an estimate — ignored below per rule).
What’s actually slow
Node 5, Index Seek on dbo.Badges.IX_Badges_UserId, is the query. It accounts for 1,057 ms of self elapsed time out of the query’s 1,215 ms total (≈87%), and its self CPU (1,057 ms) is also the largest single contributor to the 8,925 ms total CPU. Everything else is noise: node 2 (Nested Loops) contributes 115 ms self, node 4 (Index Scan on Users) contributes 46 ms self, and nodes 0/1/7 contribute effectively 0 ms self. 1,057 + 115 + 46 ≈ 1,218 ms, which reconciles with the 1,215 ms total.
Why that seek is so expensive isn’t the seek itself — it’s how many times it runs. The FORCE ORDER + INNER LOOP JOIN hints pin the join order exactly as written: Users outer, Badges inner. Since the query has no predicate on Users, node 4 must scan the entire table — dbo.Users.IX_Users_Reputation, 2,465,713 rows actual (matches estimate exactly; this index was chosen only because it’s the narrowest index covering Id/DisplayName, not a problem). For every one of those 2,465,713 rows, node 2’s nested loop drives one execution of node 5’s seek on Badges(UserId, Id). The per-thread breakdown for node 5 confirms this is genuinely 2.46M executions distributed evenly across 8 workers (855–1,057 ms each — no meaningful skew, spread is ~24%), not a skewed parallel plan hiding a smaller problem.
The seek predicate itself is fine — Badges.UserId EQ Users.Id plus Badges.Id BETWEEN 1 AND 5000 — but a cheap operation executed 2.46 million times is still the dominant cost. Node 7 (Clustered Index Seek on PK_Badges_Id, the bookmark lookup for Badges.Date) shows 0 executions: the range/UserId combination never matched a row in this run, so the query returned zero rows overall. The cost was paid entirely on the probe side, for nothing found.
What I ruled out
- Memory grant: requested/granted/used are all 136 KB, 100% utilized — trivial, not a bottleneck.
- Waits:
SOS_SCHEDULER_YIELD(8 ms / 2,226 waits) andCXSYNC_PORT(1 ms) are both negligible against 1,215 ms elapsed — the 2,226 yields are simply a side effect of a loop join iterating 2.46M times, not scheduler contention. - Cardinality estimation: no operator is off by 10x+ on a per-execution basis. Node 5 estimates 1 row/execution and actually returns 0/execution on average — a fine estimate, not a misestimate. The 2.4M “actual rows” you’d see on the estimated-plan arrow going into node 5 is total across executions, not a single bad guess (the classic “estimated 1, actual millions” trap doesn’t apply here per Step 4 — always divide by executions first).
- Parallelism skew: workers are evenly loaded on both node 4 and node 5; this isn’t a serial-plan-wearing-DOP-8 problem.
- Missing indexes / warnings: none reported. There’s no missing statistics, spill, or implicit conversion warning.
- Parameter sniffing: not applicable —
RECOMPILEis specified and the predicates are literals, not parameters.
The mechanism, and the fix
The root cause is the hints, not the index design or the statistics. FORCE ORDER prevents the optimizer from recognizing that b.Id BETWEEN 1 AND 5000 is the selective predicate here — against a Badges table of 8,042,100 rows, that range seek on PK_Badges_Id would return at most 5,000 rows outer-driven, each doing one cheap probe into Users.Id (the clustered/PK index) to fetch DisplayName. That flips the loop join from 2.46 million outer iterations to ≤5,000, which is where the 1,057 ms on node 5 would disappear.
Recommendation: drop FORCE ORDER and INNER LOOP JOIN, and let the optimizer pick the join order and join type:
SELECT u.DisplayName, b.Name, b.Date
FROM dbo.Users u
JOIN dbo.Badges b ON u.Id = b.UserId
WHERE b.Id BETWEEN 1 AND 5000
OPTION (RECOMPILE);With no forced order, the optimizer should drive from Badges filtered by the Id range (a seek on PK_Badges_Id, ~5,000 rows or fewer) and loop or hash into Users by Id, eliminating the 2.46-million-execution probe entirely. If FORCE ORDER/INNER LOOP JOIN were added deliberately to work around some other observed regression, that needs to be re-diagnosed on its own terms — this plan shows the hint itself is the direct cause of the 87%-of-runtime cost, not a symptom of something the hint was fixing.
Don’t forget.
/*
======================================================================
   TEARDOWN (optional) -- run when you're done experimenting
======================================================================
DROP INDEX IF EXISTS IX_Demo_Badges_UserId ON dbo.Badges;
*/