

My friend Erik Darling posted a video on Youtube ( (3) New Claude Plugin For SQL Server Query Plan Analysis – YouTube ) where he showed how to work with a Skill to analyze queryplan.
“Two commands to install:
/plugin marketplace add erikdarlingdata/claude-plugins
/plugin install sqlserver-query-plans@erikdarling
Then run /reload-plugins and just point it at a .sqlplan file:
why is this query slow? C:\plans\myplan.sqlplan”
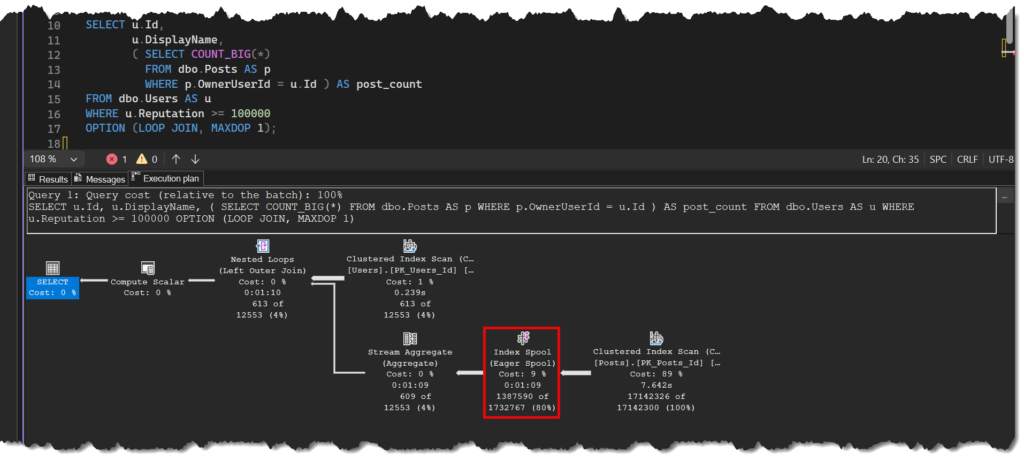
This execution plan has an Index Spool, that means that SQL Server will make a temporary index to support the query (it does not want to execute a table scan 613 times), and that takes quite a lot of time. Save the Execution plan and ask for any help.
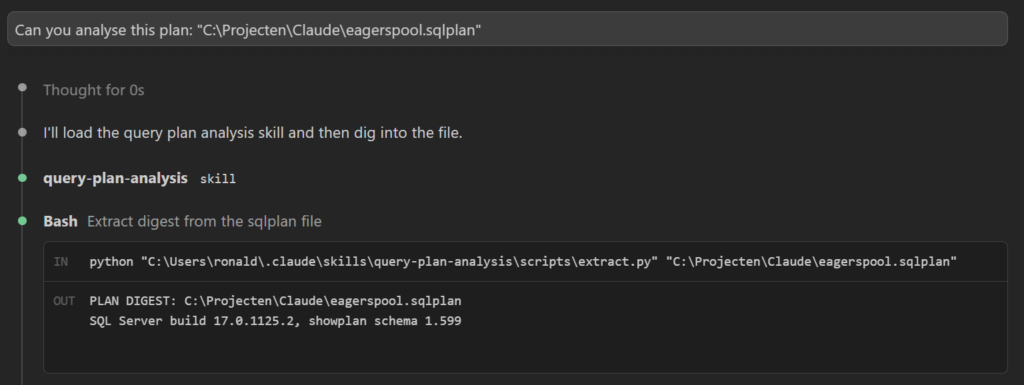
The skills loads and the query plan is examined.
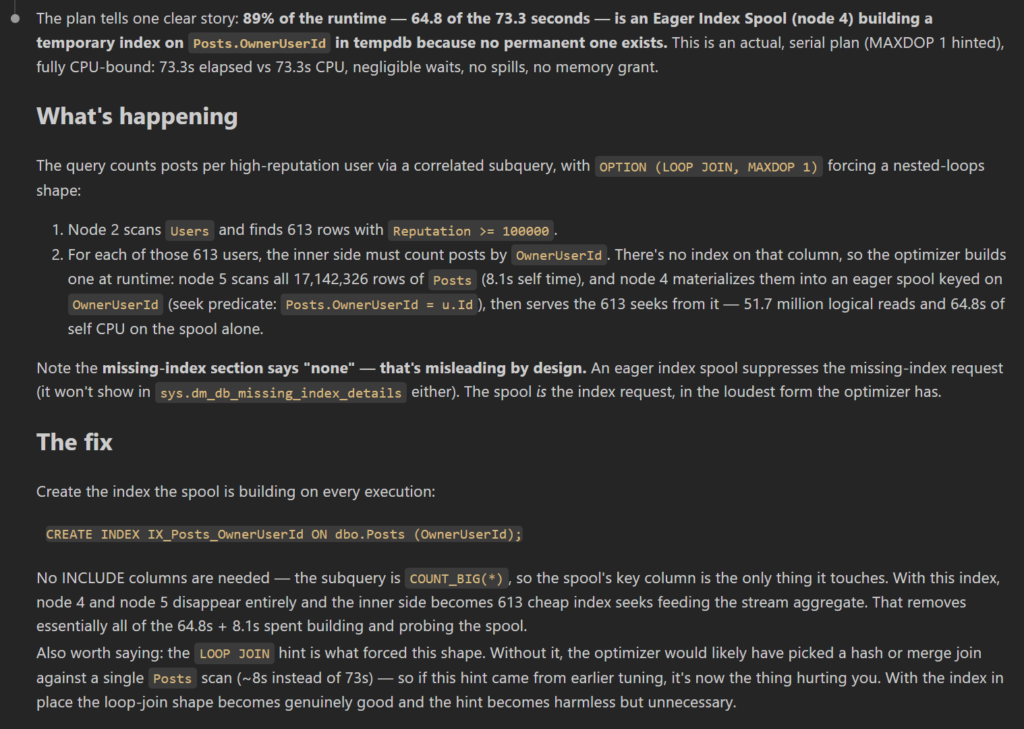
This is the solution to get rid of the part making the index, create an non clustered index.

Some stuff ignored.

After the index was created, we run and analyze that new plan, now it comes with a missing index hint.
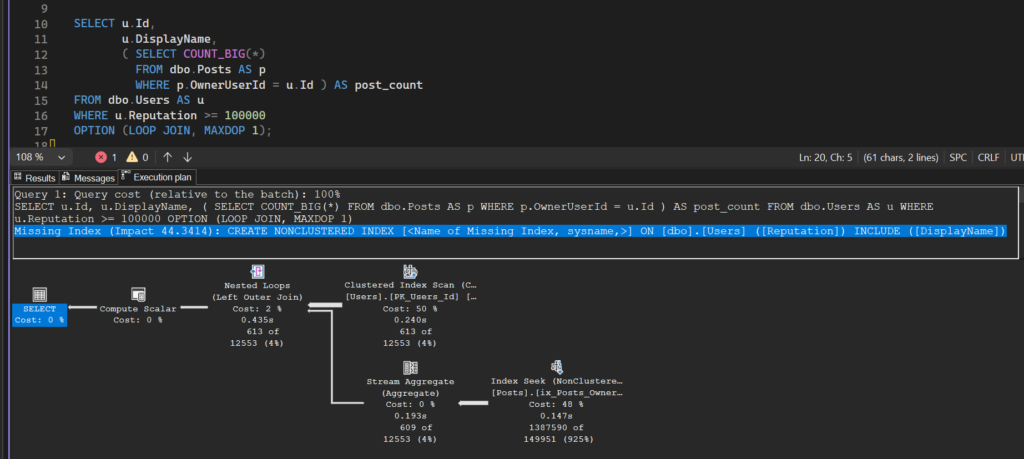
Much, mush fasterrr.
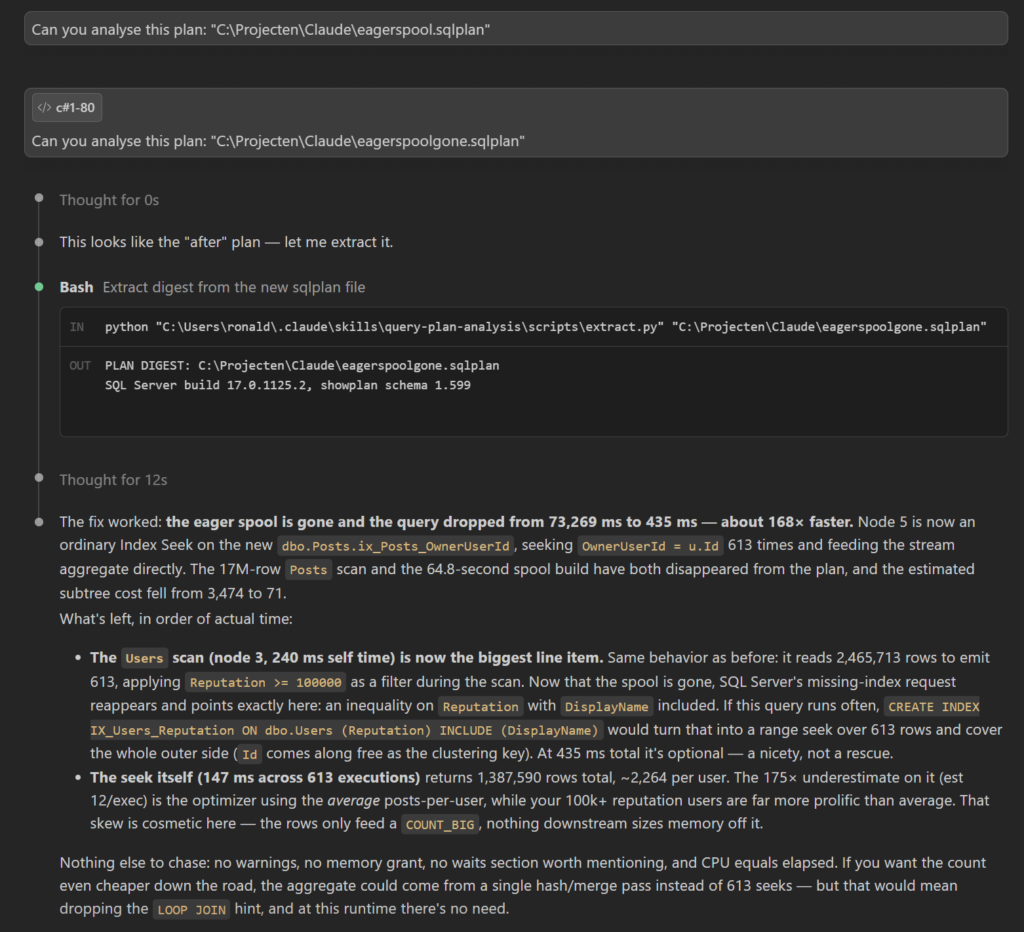
After the first attempt, there is always a new bottleneck to slice…
My conclusion: I will be flying my Tecnam Golf P96.
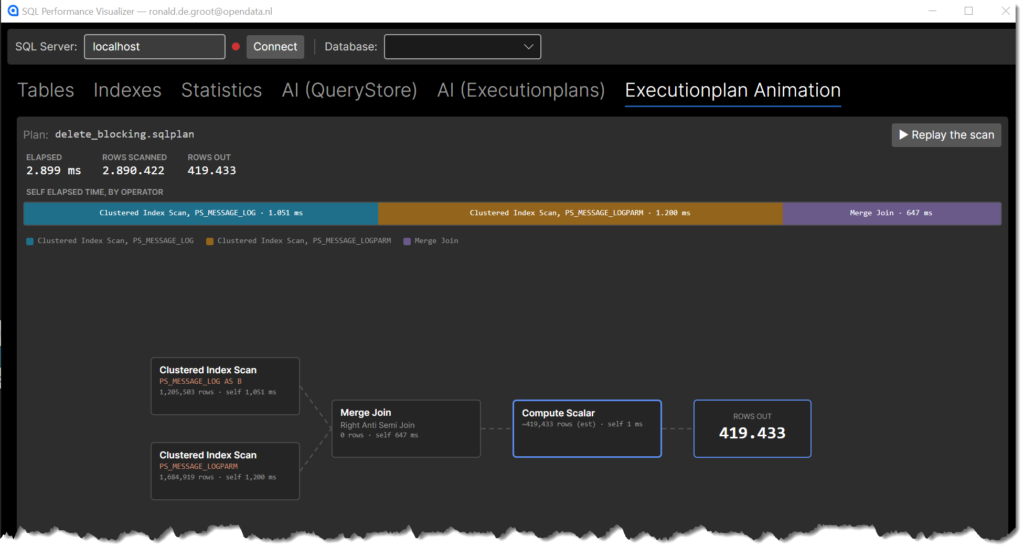
PLAN DIGEST: C:\Projecten\Claude\eagerspool.sqlplan
SQL Server build 17.0.1125.2, showplan schema 1.599
==============================================================================
STATEMENT 1 [SELECT]
SELECT u.Id, u.DisplayName, ( SELECT COUNT_BIG(*) FROM dbo.Posts AS p WHERE p.OwnerUserId = u.Id ) AS post_count FROM dbo.Users AS u WHERE u.Reputation >= 100000 OPTION (LOOP JOIN, MAXDOP 1)
— PLAN TYPE ————————————————
Runtime stats present : YES (actual plan)
CE model version : 170
Optimization level : FULL
Estimated subtree cost: 3,474.10 (ALWAYS an estimate)
Degree of parallelism : 0 (serial)
Non-parallel reason : MaxDOPSetToOne
Query time : 73,269 ms (1m13s) elapsed, 73,253 ms (1m13s) CPU
— WARNINGS ————————————————-
(none)
— MEMORY GRANT (KB) —————————————-
SerialRequiredMemory : 0
SerialDesiredMemory : 0
GrantedMemory : 0
MaxUsedMemory : 0
— TOP 10 OPERATORS BY SELF ELAPSED TIME (not cost) —–
‘self’ = this operator’s own work, children subtracted out.
Sorted by self elapsed. Self CPU is a SEPARATE clock: it sums across
threads while elapsed takes the slowest thread, so CPU exceeding
elapsed means parallelism, not a problem. Never quote one as the other.
self elapsed      self CPU        rows out   node  operator
   64,848 ms     64,832 ms       1,387,590      4  Index Spool (Eager Spool)
    8,125 ms      8,125 ms      17,142,326      5  Clustered Index Scan
      250 ms        250 ms             613      2  Clustered Index Scan
                            read 2,465,713 rows to emit 613 (4,022x)   <-- reads far more than it returns
       45 ms         44 ms             609      3  Stream Aggregate (Aggregate)
1 ms 1 ms 613 1 Nested Loops (Left Outer Join)— OPERATOR TREE ——————————————-
Children are indented. The FIRST child of a join is its outer input.
[0] Compute Scalar (est 12,553 rows, cost 0.01)
[1] Nested Loops (Left Outer Join) (est 12,553/exec vs actual 613/exec)
[2] Clustered Index Scan (est 12,553/exec vs actual 613/exec) dbo.Users.PK_Users_Id AS u
[3] Stream Aggregate (Aggregate) (est 1/exec vs actual 0.9935/exec)
[4] Index Spool (Eager Spool) (est 138/exec vs actual 2,264/exec)
[5] Clustered Index Scan (est 17,142,300/exec vs actual 17,142,326/exec) dbo.Posts.PK_Posts_Id AS p
— CARDINALITY SKEW (per execution) ————————-
node 1 Nested Loops (Left Outer Join): est 12,553/exec vs actual 613/exec over 1 exec(s) -> overestimated 20.4x
node 2 Clustered Index Scan: est 12,553/exec vs actual 613/exec over 1 exec(s) -> overestimated 20.4x
node 4 Index Spool (Eager Spool): est 138/exec vs actual 2,264/exec over 613 exec(s) -> underestimated 16.3x
— TOP WAITS ————————————————
MEMORY_ALLOCATION_EXT 666 ms (71,071 waits)
SOS_SCHEDULER_YIELD 61 ms (18,272 waits)
WRITE_COMPLETION 12 ms (8 waits)
PREEMPTIVE_OS_GETDISKFREESPACE 1 ms (8 waits)
PREEMPTIVE_OS_FILEOPS 1 ms (8 waits)
WRITELOG 1 ms (8 waits)
— PREDICATES ON CITED OPERATORS —————————-
node 1 Nested Loops (Left Outer Join)
outer refs: Users.Id (correlated – a join here needs no predicate)
node 2 Clustered Index Scan
object : dbo.Users.PK_Users_Id AS u
scan : Ordered=no
predicate : [StackOverflow2013].[dbo].[Users].[Reputation] as [u].[Reputation]>=(100000)
node 4 Index Spool (Eager Spool)
seek : Prefix: Posts.OwnerUserId EQ [StackOverflow2013].[dbo].[Users].[Id] as [u].[Id]
node 5 Clustered Index Scan
object : dbo.Posts.PK_Posts_Id AS p
scan : Ordered=no
— MISSING INDEX REQUESTS (hints, NOT ready-to-run DDL) —–
(none)
NOTE: an eager INDEX spool is present (node 4). Index spools
suppress the missing-index request, so ‘none’ here does NOT mean no
index is needed. Build the index from the spool’s seek predicate.
PLAN DIGEST: C:\Projecten\Claude\eagerspoolgone.sqlplan
SQL Server build 17.0.1125.2, showplan schema 1.599
==============================================================================
STATEMENT 1 [SELECT]
SELECT u.Id, u.DisplayName, ( SELECT COUNT_BIG(*) FROM dbo.Posts AS p WHERE p.OwnerUserId = u.Id ) AS post_count FROM dbo.Users AS u WHERE u.Reputation >= 100000 OPTION (LOOP JOIN, MAXDOP 1)
— PLAN TYPE ————————————————
Runtime stats present : YES (actual plan)
CE model version : 170
Optimization level : FULL
Estimated subtree cost: 71.03 (ALWAYS an estimate)
Degree of parallelism : 0 (serial)
Non-parallel reason : MaxDOPSetToOne
Query time : 435 ms elapsed, 435 ms CPU
— WARNINGS ————————————————-
(none)
— MEMORY GRANT (KB) —————————————-
SerialRequiredMemory : 0
SerialDesiredMemory : 0
GrantedMemory : 0
MaxUsedMemory : 0
— TOP 10 OPERATORS BY SELF ELAPSED TIME (not cost) —–
‘self’ = this operator’s own work, children subtracted out.
Sorted by self elapsed. Self CPU is a SEPARATE clock: it sums across
threads while elapsed takes the slowest thread, so CPU exceeding
elapsed means parallelism, not a problem. Never quote one as the other.
self elapsed      self CPU        rows out   node  operator
      240 ms        240 ms             613      3  Clustered Index Scan
                            read 2,465,713 rows to emit 613 (4,022x)   <-- reads far more than it returns
      147 ms        147 ms       1,387,590      5  Index Seek
       46 ms         46 ms             609      4  Stream Aggregate (Aggregate)
2 ms 2 ms 613 1 Nested Loops (Left Outer Join)— OPERATOR TREE ——————————————-
Children are indented. The FIRST child of a join is its outer input.
[0] Compute Scalar (est 12,553 rows, cost 0.00)
[1] Nested Loops (Left Outer Join) (est 12,553/exec vs actual 613/exec)
[3] Clustered Index Scan (est 12,553/exec vs actual 613/exec) dbo.Users.PK_Users_Id AS u
[4] Stream Aggregate (Aggregate) (est 1/exec vs actual 0.9935/exec)
[5] Index Seek (est 12/exec vs actual 2,264/exec) dbo.Posts.ix_Posts_OwnerUserId AS p
— CARDINALITY SKEW (per execution) ————————-
node 5 Index Seek: est 12/exec vs actual 2,264/exec over 613 exec(s) -> underestimated 174.9x
node 1 Nested Loops (Left Outer Join): est 12,553/exec vs actual 613/exec over 1 exec(s) -> overestimated 20.4x
node 3 Clustered Index Scan: est 12,553/exec vs actual 613/exec over 1 exec(s) -> overestimated 20.4x
— PREDICATES ON CITED OPERATORS —————————-
node 1 Nested Loops (Left Outer Join)
outer refs: Users.Id, Expr1006 (correlated – a join here needs no predicate)
node 3 Clustered Index Scan
object : dbo.Users.PK_Users_Id AS u
scan : Ordered=no
predicate : [StackOverflow2013].[dbo].[Users].[Reputation] as [u].[Reputation]>=(100000)
node 5 Index Seek
object : dbo.Posts.ix_Posts_OwnerUserId AS p
scan : Ordered=yes FORWARD
seek : Prefix: Posts.OwnerUserId EQ [StackOverflow2013].[dbo].[Users].[Id] as [u].[Id]
— MISSING INDEX REQUESTS (hints, NOT ready-to-run DDL) —–
dbo.Users (claimed impact 44.3%, of an ESTIMATED cost)
INEQUALITY: [Reputation]
INCLUDE : [DisplayName]
NOTE: equality column order is arbitrary; existing indexes are ignored.