
If you have a lot of database maintenance jobs on different schedules it is hard to see which ones overlap and are not taking advantage of resources. The job visualizers I know are mostly reporting based and hard to get to work. This one has no dependencies, just msdb. So me and my friend Claude sat down and had some nice conversations. The results are here.
I took some effort to make a beautiful icon (Erik Darling should do a better job with his nice tools, I always select the wrong icon).
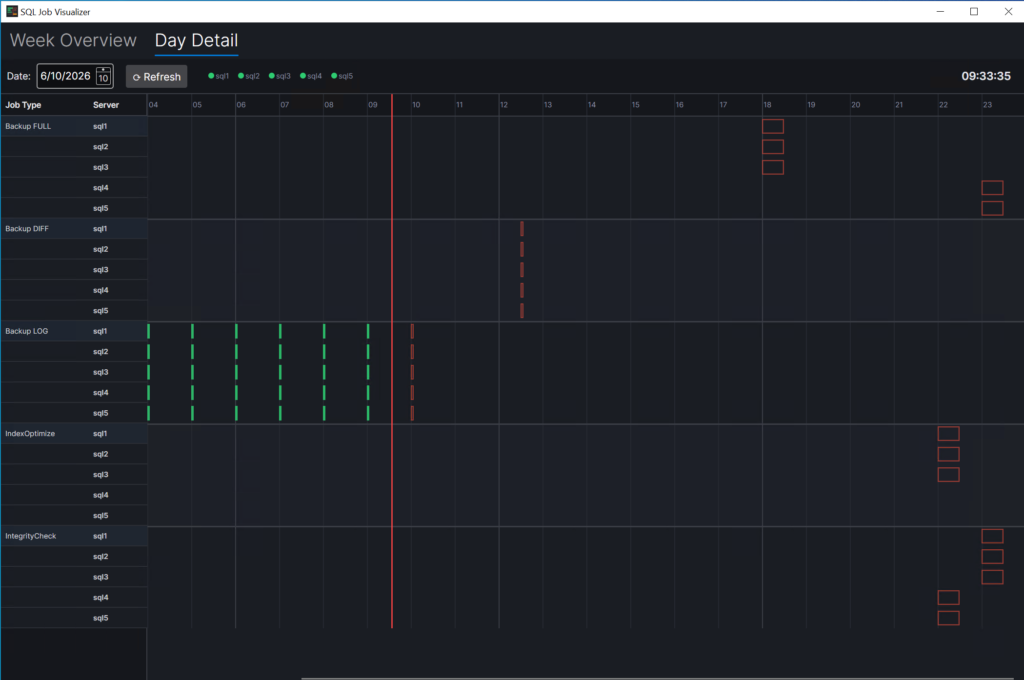
Here you see a red timeline, in green the jobs that have been executed, in front of the timeline the first job to be executed.
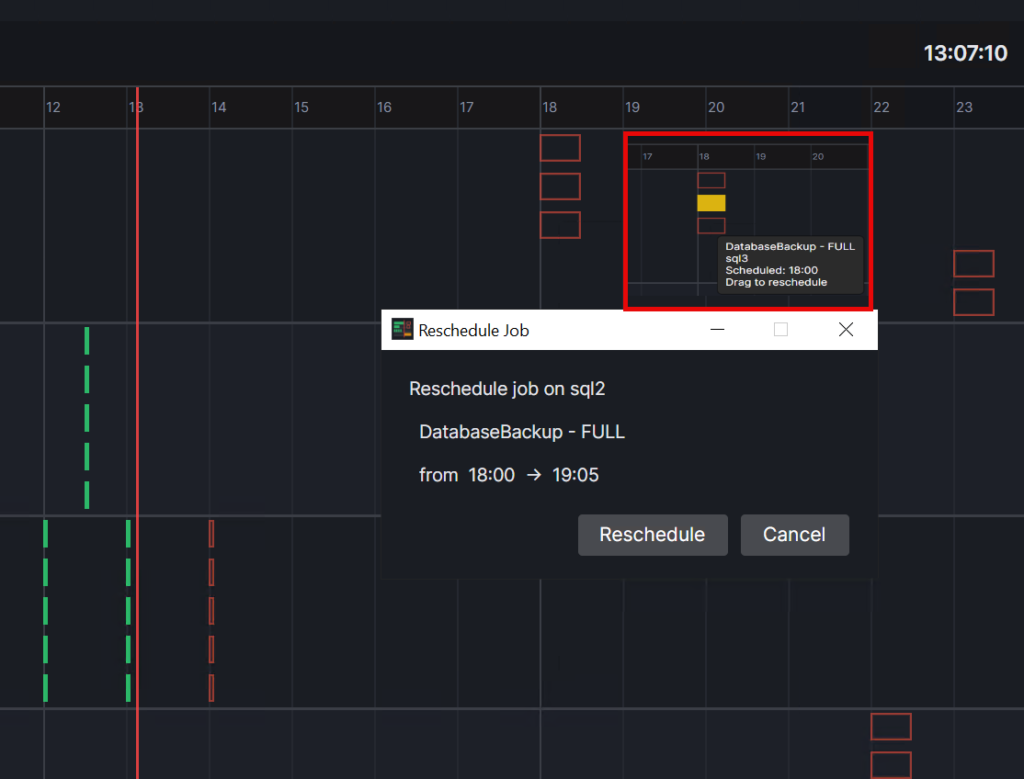
If the schedule is not what you want, just change it by selecting it and move somewhere. A reason could be blocking issues caused by the storage component.
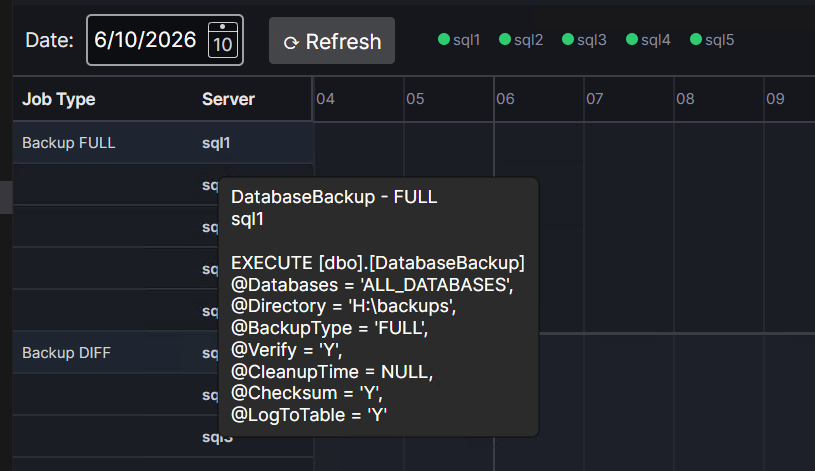
Getting information about the job is always convenient instead of clickertheclick.
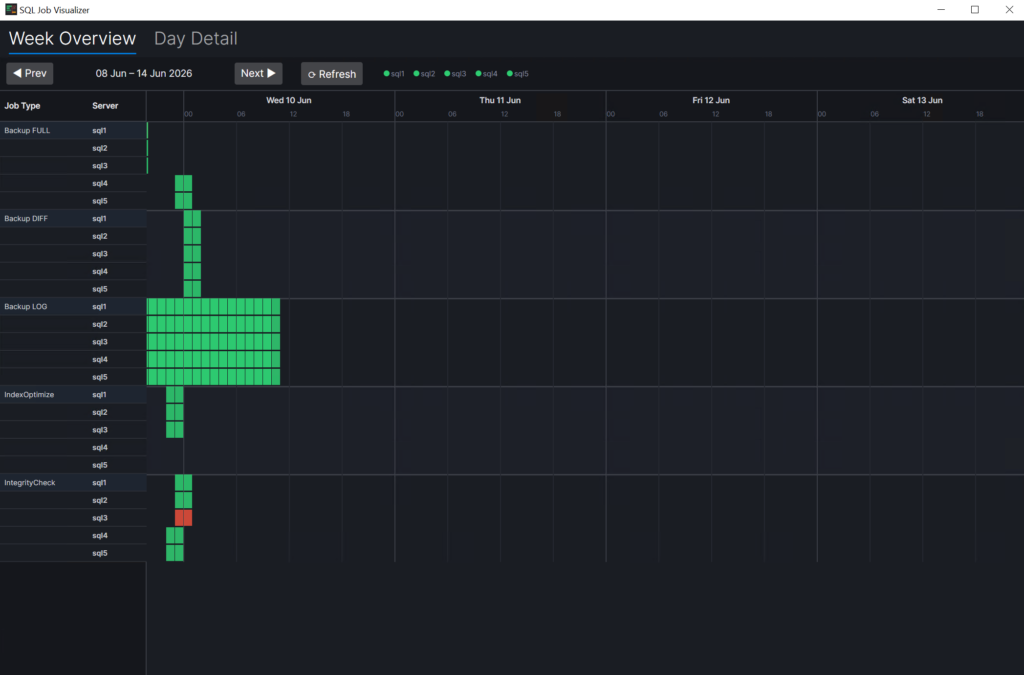
If a job fails it shows red.
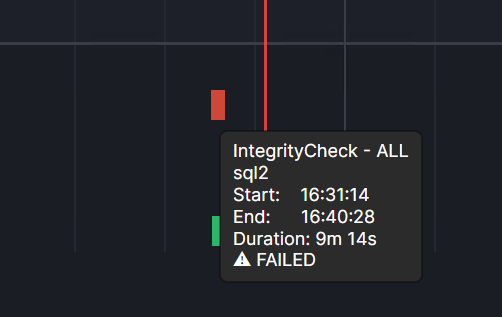
For example when the disk is full.
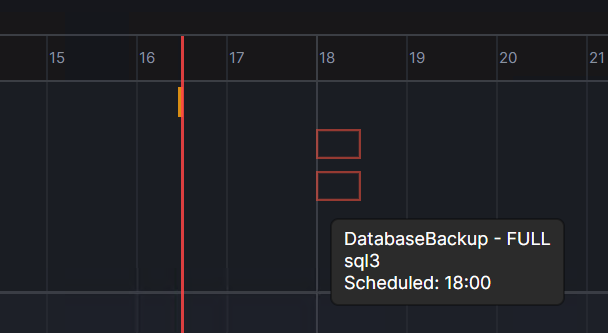
If you hoover over the hollow red box you get some information about the next run time.
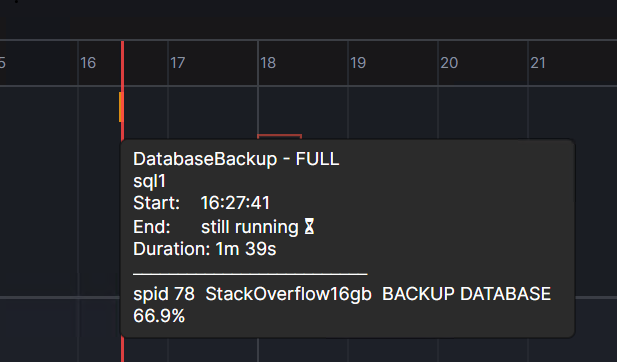
If you hoover over the box (a little bit difficult to see) when it’s running you see details about the current statement, spid and database.
Configuration can be done by changing server names and job names in config.json.
There is a Github repo: ronaldgithub/SQLJobVisualizer: Shows timing information about SQL Server Jobs
Thanks for reading.